Intermarket Flow
Home Methodology Intermarket Reports Pricing
Member Login
Home Methodology Intermarket Reports Pricing Member Login

Category: Mid-Week Report

Chart comparing SPX, US Net Liquidity, and Global Liquidity. Macro Narratives.

#34 A Guide to Understanding Macro Narratives in Trading.

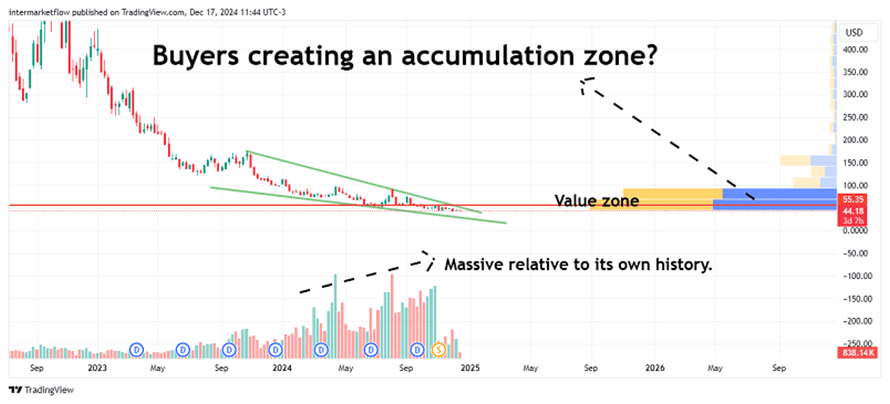
Stock chart showing potential accumulation zone. Shorting TECS

#33 Technical Setup for shorting Tecs 

Chart comparing 2-year nominal and real yields. year real yields

#32 Trading movements in the two year real yield.

A line chart comparing the performance of the healthcare sector to the overall S&P 500 index.

#31 Trading sectors in a bubble environment

A chart showing the 10-year to 2-year yield spread, with historical recessions highlighted.

#30 10-2 Year Yield Spread: Impact on Bonds, Rates and Trades.

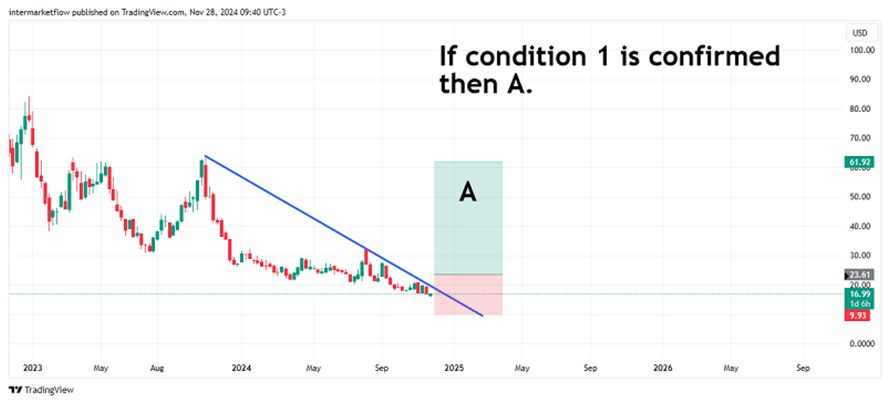
A weekly chart showing a potential price target if a specific condition is met. 10-year real rate.

#29- B Trading the 10 year real rate.

A line chart showing the divergence between the US 10-year nominal interest rate and the US 10-year real interest rate,

#29 10-Year Real Rate Trading: A Complete Guide

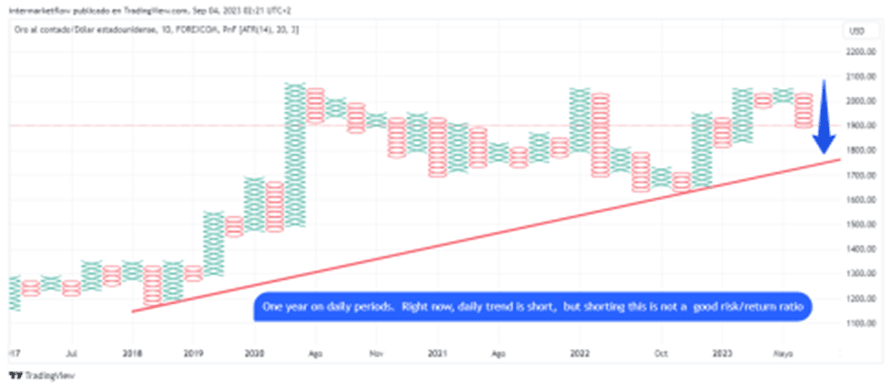
Point and Figure chart displaying a one-year daily trend analysis with a red upward trendline and a blue downward arrow indicating a short-term bearish trend.

#28-C Point and Figure Basics: Charting Objectives Explained

A daily candlestick chart with a downtrend line and highlighted trading zones, showing a potential reversal in the price trend. The chart could be used by traders to identify potential entry and exit points, taking into account factors such as the two year real rate and other economic indicators.

#28-B Trading a global economic slowdown through eurozone weakness

  • 1
  • 2
  • 3
  • 4
  • 5
  • 6
  • 7
  • 8
  • 9

© 2026 IntermarketFlow. All rights reserved.

703 Waterford Way, Suite 805, Miami, FL 33126

Privacy Policy | Terms of Service | Contact

IntermarketFlow is an independent financial research publication. The service provides general market commentary, quantitative analysis and educational information. It does not provide personalized investment advice, portfolio management or recommendations to buy or sell financial instruments.