
Z-Score and Intermarket Analysis
Z-Score in Intermarket Analysis
The Universal Language of Market Extremes
The Z-score is the core statistical metric used across our framework to normalize and compare completely different asset classes and variables under a single universal scale.
Z-Score, in Plain English
How unusual is this move? A 5% move may be routine for one asset and exceptional for another. The Z-score puts both on the same scale, measuring each against its own history. The farther from zero, the greater the departure from its average.
How to Read a Z-Score
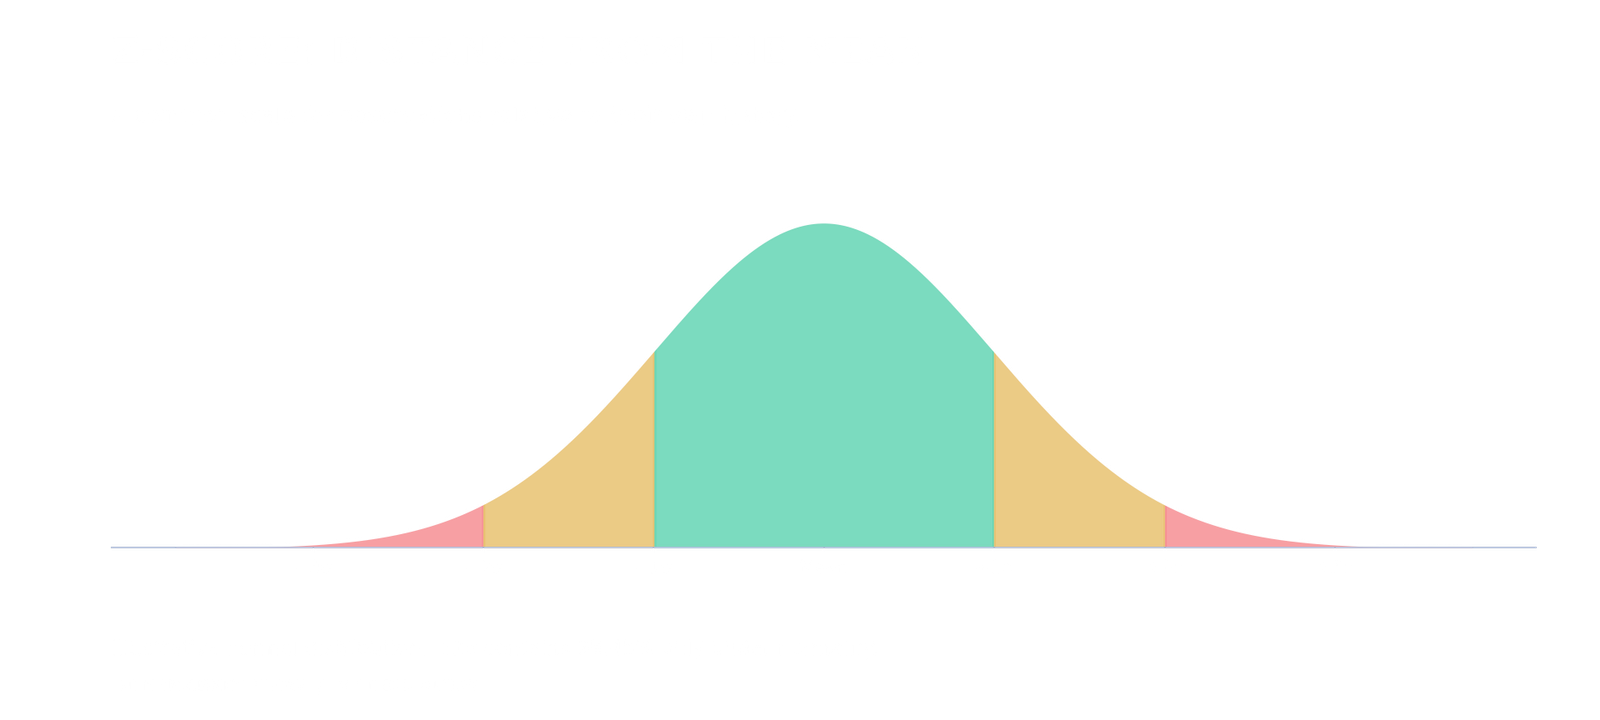
A Z-score measures distance from the historical average in standard deviations:
- 0: equal to the average.
- +2: two standard deviations above the average.
- −2: two standard deviations below the average.
The sign indicates position relative to the average—not a gain or loss. A positive return can have a negative Z-score if it falls below its historical average.
Why Standardization Matters
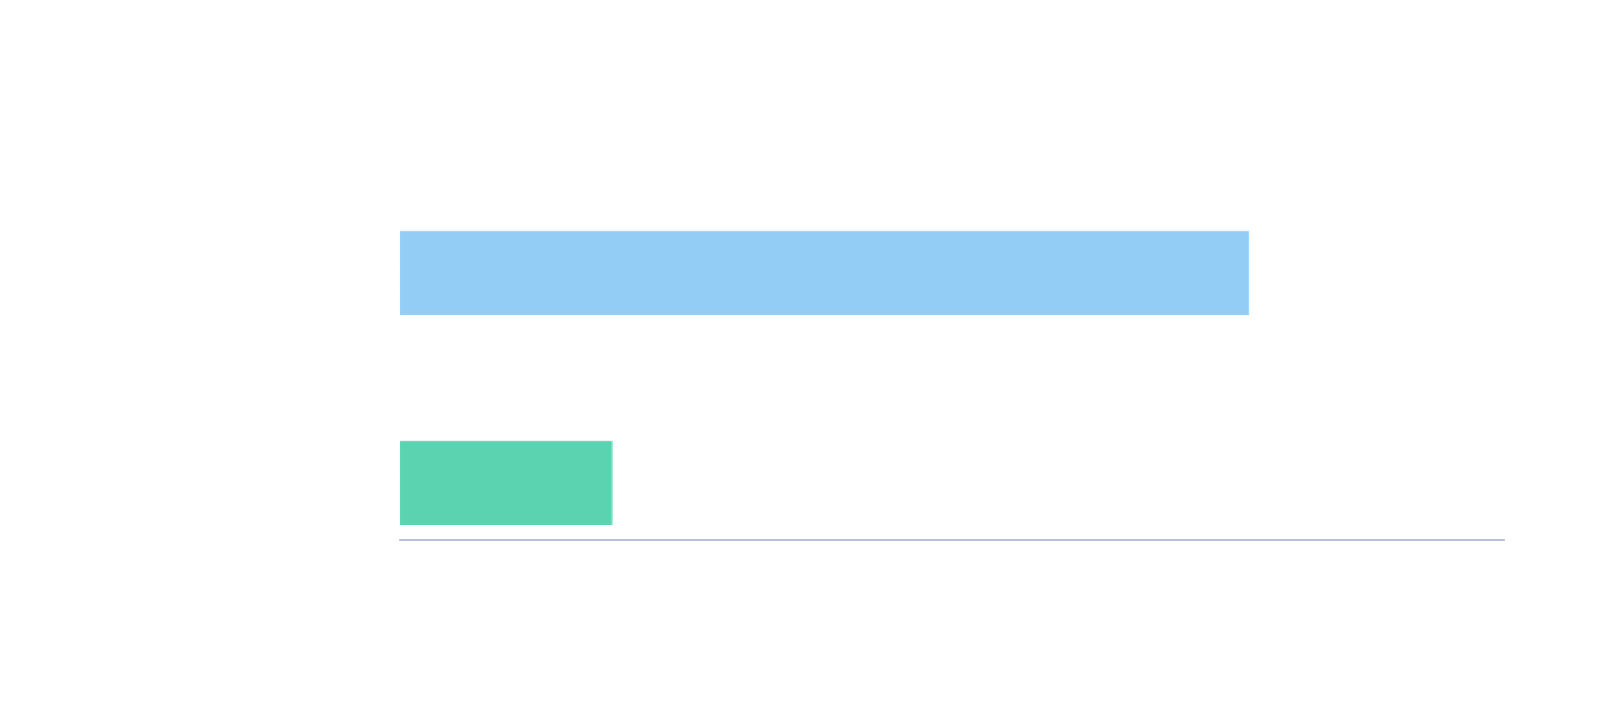
Two assets can both return 2% in a week, yet produce very different Z-scores. The same principle applies to volume and volatility: each observation is measured against its own historical reference.
Z-score = (observation − historical average) ÷ historical standard deviation.
How Intermarket Flow Uses Z-Scores
We track Z-scores across markets and time horizons to assess returns, participation and volatility. Their evolution and alignment help distinguish supported moves from divergences.
This common scale connects the broader market picture in Intermarket Risk Regime Analysis with the individual market groups and instruments covered in Intermarket Category and Asset Analysis.
Readings beyond ±2 flag large departures from the average. They do not confirm a reversal. Market data need not follow a normal distribution, and identical Z-scores do not imply identical risk.
Current Z-Score Analysis
Access the latest Z-score and cross-asset report covering current market positioning.
Twice-Weekly Intermarket Reports
Get institutional cross-asset analysis every Sunday and Wednesday. Subscribe below to receive our research directly.