#65 Jackson Hole Reactions, Rate Cuts and the Intermarket
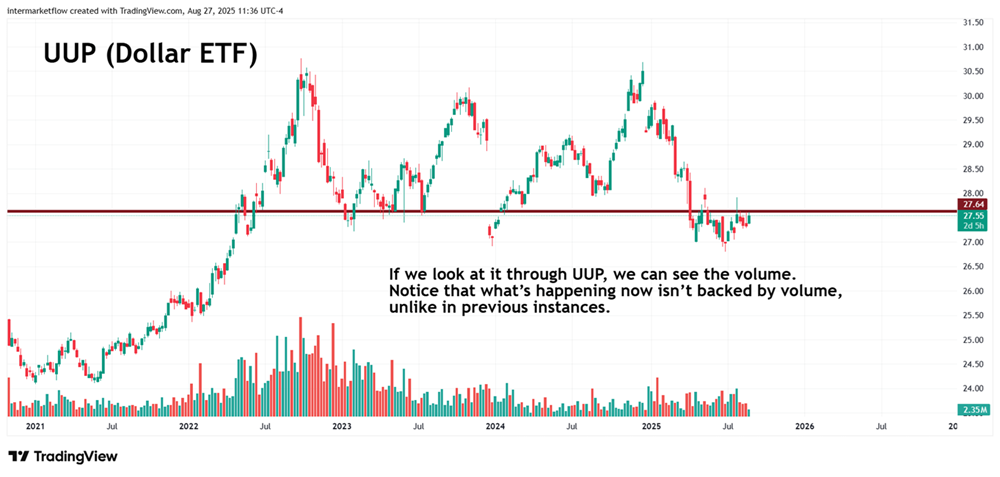
We analyze the intermarket moves that took place after the Jackson Hole conference. We seek to identify where capital flowed.
#64 Z-Score: A statistic every trader must understand
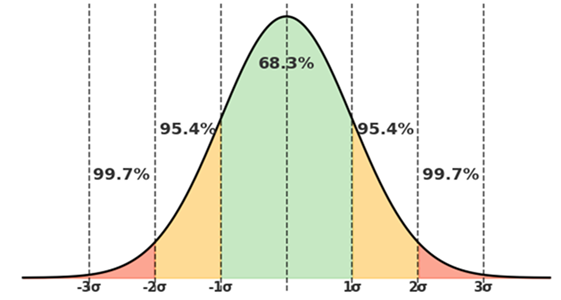
Intermarket Analysis Throught Macro and Technical Methods Here you will find: The concept of Z-score, clear and simple so that everyone can understand it.The theoretical mathematical foundation where it originates. We’re going to use this metric a lot in the services we’re launching. It’s important that you understand it so we can move […]
#47 Before we begin—here you´ll find:
The State of the American Consumer and Why a Correction Is Imminent. #47 Current expectations of the American consumer—and the trades they’re generating, at a systemic level. We’ve already looked at this from the perspective of real and disposable income—over six months ago here. Now, let’s examine it through the lens of current consumer expectations. […]
#45 We are entering Stage 4 of the Macro Narrative

We believe a new macro narrative is now dominating the market, centered around future economic growth expectations.We see this as the start of a bearish trend, not just a market correction. This means a return to trend-following trading systems but in opposite direction.
#44 Explorer: Reports to measure and quantify the labor market.

Intermarket Analysis Throught Macro and Technical Methods Reports to measure and quantify the labor market. Labor market Monthly reports, sources, data collection, and information loading by Government Agencies. Labor market: Public Reports These are the 10 most well-known reports conducted by the public sector. The ones highlighted in blue (including the Non-Farm Payroll, historically the […]
#41b) Technical Setup: Trading a Macro Narrative in Stage 3.
Here you’ll find:
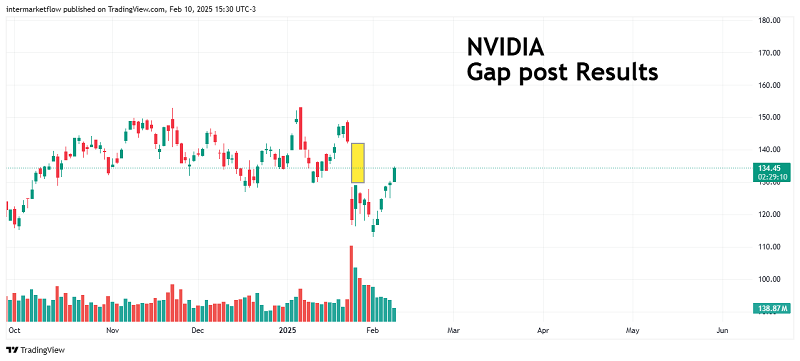
The reaction to the earnings announcements of Google, Amazon, and NVIDIA.
The similarities and differences between them.
The charts that, from a technical perspective, indicate the sector is very close to a correction.
#41a) Observing reality through the prisms of intermarket, technical and macroeconomic analysis.
Here you’ll find:
The reaction of Amazon, NVIDIA, and Google to their earnings announcements.
Why the results weren’t as expected and the similarity in the price reactions of the 3.
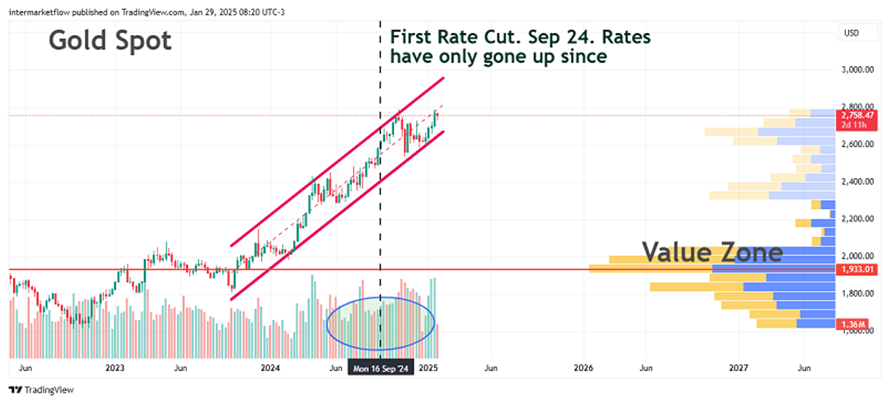
The clearest message from the intermarket: gold in full stage 1 of price action.
Macro analysis of the American real estate sector.
Analysis of the sector’s ecosystem: Prices, Rates, Inventory, and outlook.
Various setups for trading with different technical strategies, in this case, in the tech sector. These are published in the next blog article. #42
#40b)SETUPS: Trading in a Risk-off Environment.
Here you will find:
1. A brief description of the Pension Fund’s way of thinking.
2. Mainly a trade originated in the Intermarket Analysis.
3. The process of choosing a vehicle
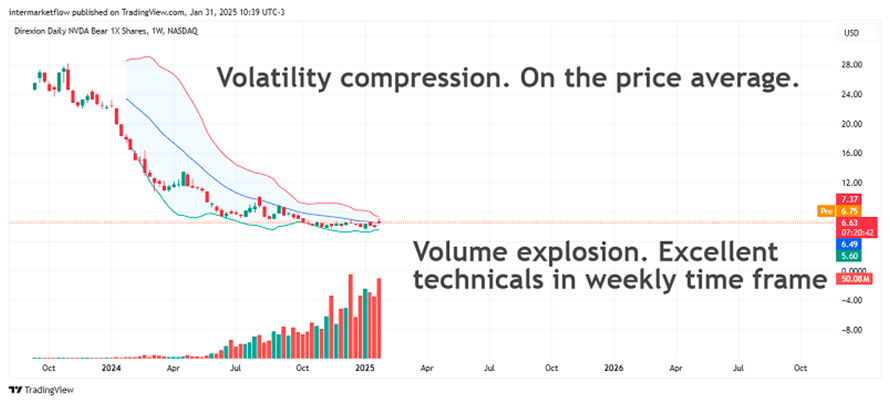
4. Complete technical setup for NVIDIA shorting.
#40a) Inter Market Analysis update, it couldn’t be clearer.
Here you will find a complete inter-market analysis as of today for:
1 Rates, in the different sections ot the curve. (Bonds)
2 Stocks.
3 Commodities.
4 Currencies.
Conclusions from analyzing the 4 mother categories.
#39 Trading reversion to the mean.
Here you’ll find a complete technical setup: volume, trend, momentum, and mean reversion. Entry and exit zones are clearly defined. This aligns with or is a consequence of the macroeconomic analysis presented in the previous article.