#39 Trading reversion to the mean.
Here you’ll find a complete technical setup: volume, trend, momentum, and mean reversion. Entry and exit zones are clearly defined. This aligns with or is a consequence of the macroeconomic analysis presented in the previous article.
#38 The small banks: risks and threats they are facing
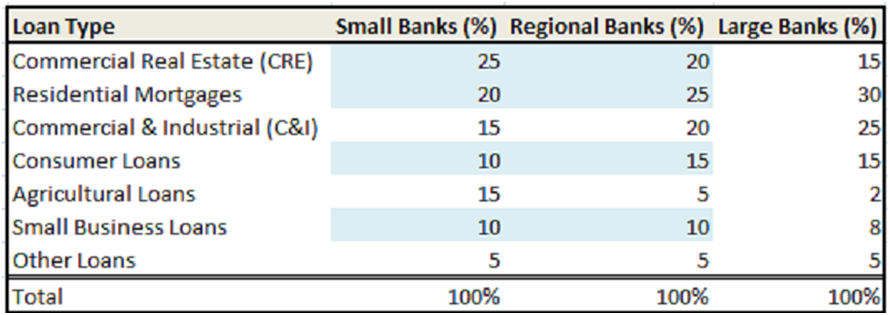
Here you’ll find a complete technical setup: volume, trend, momentum, and mean reversion. Entry and exit zones are clearly defined. This aligns with or is a consequence of the macroeconomic analysis presented in the previous article.
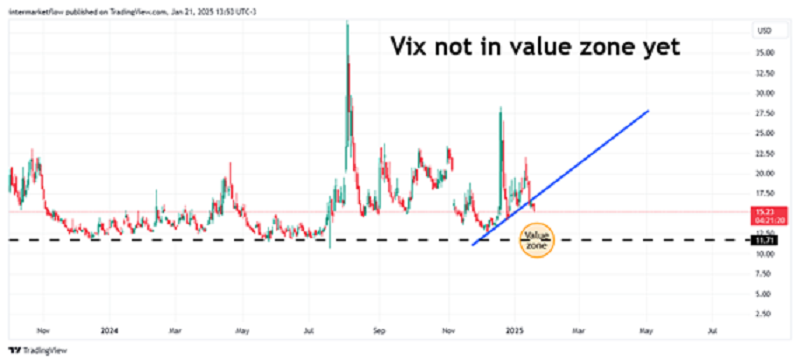
# 37 Complete Technical Setup: Looking for weaknesses.

Here you’ll find a complete technical setup: volume, trend, momentum, and mean reversion. Entry and exit zones are clearly defined. This aligns with or is a consequence of the macroeconomic analysis presented in the previous article.
#36 Effects on the real economy and generation of incorrect incentives by the lender of last resort.

In this article, we explore how the revelation of the Fed’s reaction function—essentially, “we saved everyone”—not only presents a moral hazard but also creates incentives for greater risk-taking, particularly by small banks. An industry that is, in fact, overcrowded.
#35 Setup: Setting up a strategy and macro narratives.
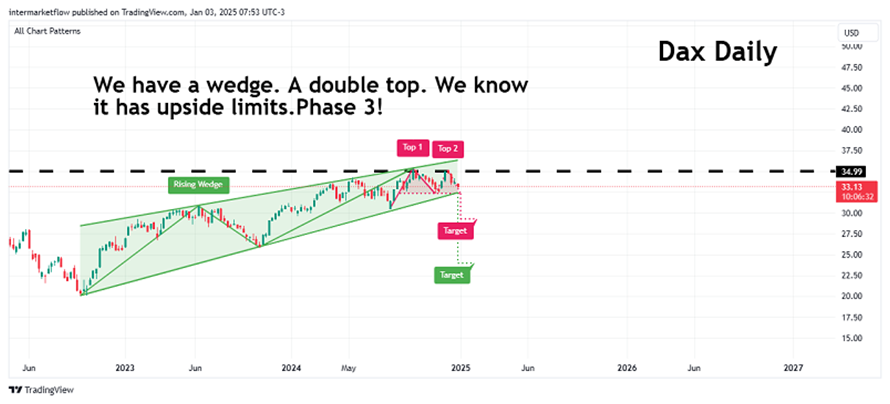
This is a complete technical setup to trade the DAX on the short side. It includes liquidity, long-, mid-, and short-term trends, momentum, mean reversion, and alternative vehicles to execute this macro view.
#34 A Guide to Understanding Macro Narratives in Trading.

Here you’ll find:
The relationship between macro narratives and the markets.
The evolution of a macro narrative.
The typical price behavior at each stage of the narrative.
An intermarket analysis covering the four categories to see how we’re starting 2025.
A technical setup derived from the analysis and aligned with our macro view.
#33 Technical Setup for shorting Tecs
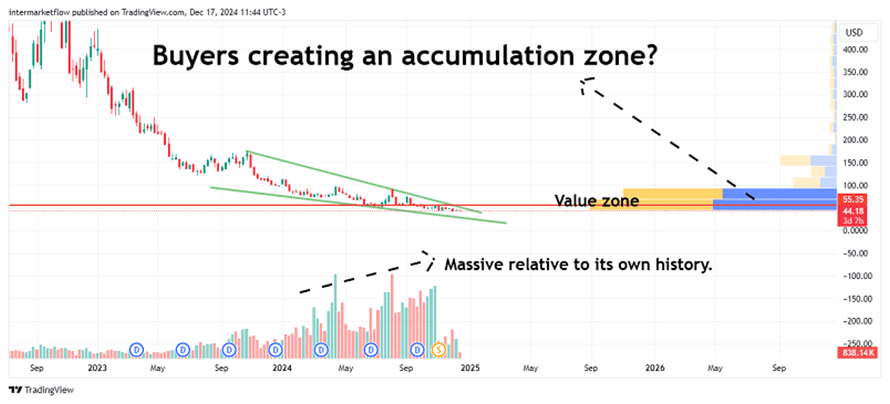
This chart caught our attention due to the divergence we observed in volume. It aligns with our macro view, and we have chosen it as the vehicle for an aggressively defensive trade, targeting what we believe to be a point of weakness: the S&P 500.
#32 Trading movements in the two year real yield.

In this article, we analyze the 2-year nominal rate from September 18, when the rate cuts began, to December 18, which marks the most recent cut to date. We break down the nominal rate to understand what happened with its components: the real rate, inflation expectations, and the term premium. The conclusions are compelling.
#31 Trading sectors in a bubble environment

In this article, you’ll find:
The relationship between momentum and mean reversion.
The importance of tracking momentum at extreme or overextended price levels.
Relative ratios between sectors.
Where we see opportunities and where we don’t.
A general view for portfolio positioning today.
#30 10-2 Year Yield Spread: Impact on Bonds, Rates and Trades.

In this article, we delve into the 10-2 year spread. We explore how it works, why it’s a leading indicator, and how it relates to other indicators derived from the yield curve.