Intermarket Analysis Throught Macro and Technical Methods
Trading movements in the two year real yield.
Analyzing Market Trends.
On September 18, the FOMC initiated this rate-cutting cycle. From that date until today, we have:

At the next FOMC meeting on January 29, the market expects no changes in interest rates and assigns this scenario an 81% probability.
Recalling the macroeconomic identity that establishes:
Nominal Rate = Real Rate + Inflation Expectations + Term Premium.
Short-Term Real Yield Fluctuations: Key Drivers.
Two year real vs nominal yield.

Changes in the components of the real rate since the start of the rate-cutting cycle.
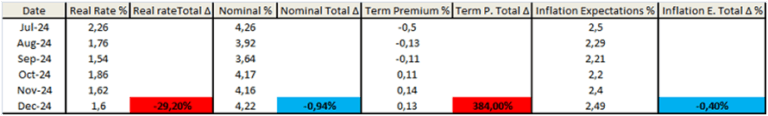
In blue,the components that remained stable or very similar. In red, the components with the most significant changes.
The numbers:
• The nominal rate remains practically the same.
• Inflation expectations are unchanged from September.
• The real rate dropped by 29.2%.
• The term premium increased by 384%, which partly explains why the nominal rate stayed stable.
Interpreting what happened between September 18 and December 18.
- The market sees a sharp decline in the real interest rate. Here, we observed the effects and amplification this entails.
- Inflation expectations remain stable, meaning the market does not foresee further declines.
- There is a heightened perception of interest rate risk (Term Premium).
- While the nominal rate remains unchanged, the market interprets the situation very differently beneath the surface.
If this trend persists, we could see inflation in an economy with progressively lower real interest rates.It wouldn’t be stagflation yet, as the real rate remains positive, but the trajectory of these variables points in that direction.
Past Inflation.

Since February 2021, when inflation surpassed the first target of the Federal Reserve’s mandate, it has remained above that level to this day.
This is the core issue. The decline in real disposable income for a portion of the population is being compensated with low quality credit (as we discussed here).
Why does the economy keep functioning?
Because credit, in its various forms, is compensating for the decline in real disposable income.
Intermarket Analysis:
U.S. stock market futures for March 2025.
The U.S. Dollar Futures for March 2025.

The market anticipates the U.S. dollar to be 2.76% higher by March 2025, closely aligned with expected inflation.
The CRB futures for Jan/Feb 2025.
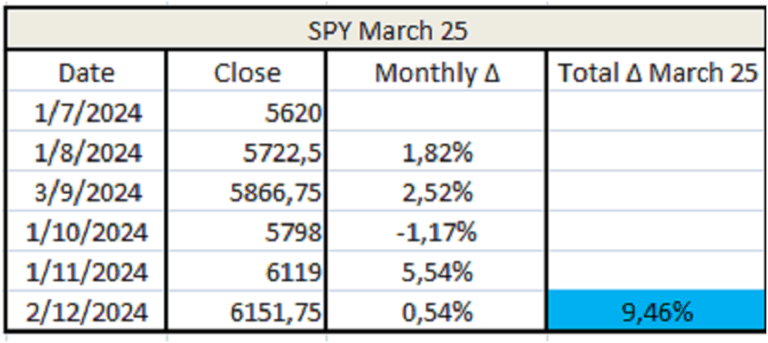
The market currently anticipates 9.46% growth in the S&P 500 by March 2025, effectively continuing the bubble at a ≈3% monthly rate.

In line with expected inflation.
The 2-Year Bond Futures for March 2025.

We’ll have to see in March if this increase holds and what causations it reveals.
Conclusions:
By March 2025, the market expects:
- Real growth in stocks.
- The rest to hover around expected inflation.
Interpreting.
- We are in a situation where the “parent market” (bonds) is perceiving more risk.
- The stock sector has high valuations, in some cases extremely high, and is expected to continue growing at ≈3% monthly.
- Relative to historical levels, commodity futures are very low.
As we discussed, commodities speak a universal language. They are produced and traded worldwide, so their prices reflect global supply and demand.
Trading.
How to proceed in a situation where the riskiest category—stocks—is the only one growing, in a context where the market perceives increased risk.
Additionally, we have extensively argued our macroeconomic hypothesis throughout the blog. I don’t want to be repetitive, but the statements we make here are not made lightly.
Trading defensive basics:
Depending on the landing we anticipate, these can be extremely defensive:
- Cash/Gold: Cash yields 1.6%, while gold’s return depends on its price evolution.Currently, it has an opportunity cost of 1.6%. With expected inflation at ≈2.5% and a real rate of 1.6%, this cost is very low.
- Rotation to historically defensive sectors: We reviewed relative valuations here.
- Aggressively defensive operations: These involve targeting assets we consider to be out of equilibrium.
Trading Aggressively:
In the current context, it’s about identifying tops or bottoms—a highly risky strategy and, therefore,potentially very profitable.
Here, we share a setup to monitor and highlight inflection points that could confirm a potential correction.
The Vehicle:
We believe the greatest weakness lies in the S&P 500, particularly in the technology sector.
Are we crazy?
Yes, a little, but…
- Given their valuations, the level of performance required to sustain them, get them exposed.
- This in turn impacts the entire S&P 500.
- We discussed this, and analyzed the structure of the bull market in the S&P.
Yes, a little, but…
- Given their valuations, the level of performance required to sustain them, get them exposed.
- This in turn impacts the entire S&P 500.
- We discussed this, and analyzed the structure of the bull market in the S&P.
The complete setup from this analysis can be found in the following blog article.
The year is coming to an end—enjoy it with your loved ones, celebrating life!
Enjoy!
Martin
Intermarketflow.com
- Intermarketflow