Intermarket Analysis Throught Macro and Technical Methods
10-2 Year Yield Spread: Impact on Bonds, Stocks, Rates and Trades.
In this article, you’ll find:
- The economic and mathematical explanation of the 10-2 year yield spread.
- Why it influences investment, saving, and spending decisions for all economic agents.
- Its predictive power as a leading indicator of future recessions.
- The consolidation of the four interpretations of the yield curve we’ve been publishing and the timelines they suggest for the next recession, as well as the effectiveness of each.
- The real interest rate values for 10- and 2-year terms, and why we believe this is the main driver pushing the rise in all assets.
- What to expect from the government regarding monetary and fiscal policy in the event of a recession.
Interpreting the 10-2 Year Yield Spread.
We’ve discussed here that the 10-year rate is the central rate of the economy. Consequently, the 10-2 Year Yield Spread is the most closely watched spread and part of the curve.
Essentially the spread, particularly its slope, reveals what the market expects for the economy over the next 2 to 10 years. This trend influences all types of economic decisions—investment, consumption, saving, etc.
Mathematically, the 10-2 Year Yield Spread is the 10-year nominal rate minus the 2-year nominal rate.These values are plotted daily, creating a function that reflects the movement of both rates. Which, in turn, reflect the market’s expectations for each term.
The 10-2 Year Yield Spread on a Weekly Time Frame.
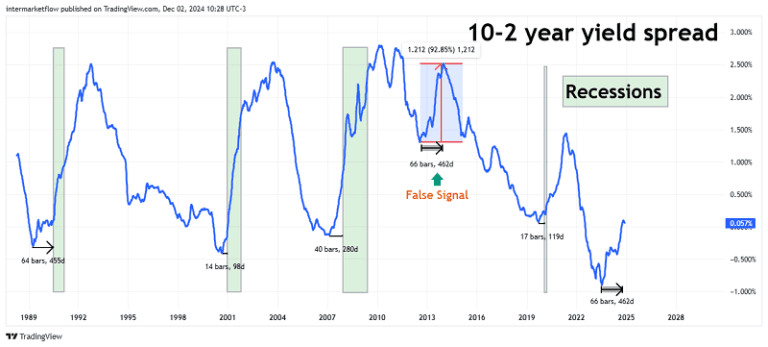
The gray-shaded areas represent the last 4 recessions. Over 34 years, it has accurately predicted each recession, with only one false signal in November 2012. Every time thespread hit a low, a recession followed shortly after.
The 10-2 Year Yield Spread: Quantifying the Numbers.

If guided by this “indicator,” the next recession would likely start in March/April 2025, with an 80% probability.
Yield Curve Interpretations as Leading Indicators.
In July this year, we published an article analyzing the yield curve using three methodologies with different time horizons:
- Time from the first rate cut to the start of the next recession: A very short-term analysis with 100% effectiveness.
- The 10-2 year yield spread: A medium-term expectations analysis with 80%
effectiveness. - Minimum in the 30-Fed Funds spread: A long-term curve analysis with 100%
effectiveness.
All quantified over the past 34 years, from the 1990s to today.
Of course, we also included the most popular yield curve indicator: its inversion. The inversion consolidates all the information analyzed separately in points 1 to 3.
Interpreting Market Indicators: Bond Yield Insights
Combining the data from the July article with the insights generated in this
December 2024 article, we present the following table:

Each methodology provides an average lead time to the next recession. In some cases the data range is so wide that the average doesn’t accurately reflect reality. However, in this latest inversion episode, the average lead times of all four methodologies align closely.
Such precision is a bit unsettling, especially given that economics is a social science dependent on the interactions of millions of individual agents.
I repeat, we are talking about average dates!
Government Intervention: What to Expect
Governments have two primary ways to intervene:
- Monetary Policy in its various forms.
- Fiscal Policy through different applications.
- Monetary Policy
This is the area where macroeconomic science has advanced the most. Past crises have provided valuable lessons, creating a useful, though still incomplete, “know-how.”
Key points:
- Speed and magnitude of adjustments remain challenging.
- Implementation timing still lags, reacting instead of anticipating.
- Effectiveness and efficiency vary across macroeconomic contexts.
- Several monetary tools are available, but their efficiency and impacts are still under study.
- Fiscal Policy
This area is far less explored, and its short-medium- long term effects remain an academic debate.
Key uncertainties:
- No standardized metrics exist, apart from comparisons relative to GDP of other countries.
- The marginal productivity of monetary injections is unclear, as are their real effects.
- Each economy is at a different stage, so the same fiscal injection can yield varying results.
- Trust levels among local and international agents affect outcomes. A fiscal deficit in Country A might have very different effects than one of the same size in Country B.
What We Know:
- Fiscal measures are politically convenient and on the rise globally.
- Public sector spending is less efficient than private, leading to inherent inefficiencies.
What to Expect in a Crisis:
- Liquidity support for distressed institutions, especially credit-related ones.
- Rapid, significant rate cuts during acute economic downturns.
- Central bank balance sheet expansions, increasing monetary base liabilities against likely lower-quality assets. This mirrors recent regional bank crises.
- Higher fiscal deficits, essentially injecting money into the real economy.
Market and Government Expectations:
The challenge is that the market already anticipates these interventions. It knows they will be implemented, yet maintains the expectations discussed
earlier.
Implications for Investors.
Our hypothesis for navigating this environment is clear and has been thoroughly argued in previous blog posts.
Before diving deeper into analyzing the deceleration-recession in the U.S., Europe, and China—or valuations across and within asset categories—we first need to assess the structure of the S&P 500’s current bull run.
S&P 500 Monthly: A Completely Distorted Index.

If one focuses exclusively on price action, the bullish trend appears incredibly strong. The problem arises when analyzing the market structure. It’s exposed, with low volume, far from the zone where the market perceives value and sustained by massive earnings expectations in the tech sector.
S&P 500: Key Technical Points Key considerations from a technical analysis perspective.

Price Movements.

Momentum at these extremes is the most important indicator. Sometimes, the best insight isn’t about where the price is going but rather where it doesn’t want to go—or simply can’t!
Analyzing the S&P 500 doesn’t make much sense due to the distortions we’ve already mentioned.
Real Interest Rates and Asset Prices.
Our Hypothesis Within the macro and global context we’ve developed across several articles (macro, global, stage of the cycle), a decline in real rates can impact the real economy in the following ways:
- Financial Assets:: Prolonged low rates can inflate prices of stocks, real estate, cryptocurrencies , bonds, commodities, etc beyond their fundamentals. Is there any resemblance to reality here?
- Reduced Returns for Savers and Conservative Investors: This reinforces point 1.
- Distortions in Capital Allocation: Low-return or risky projects may get funded when they shouldn’t.
- Banks’ Margins Shrink, Reducing Profitability: This feeds into the issue described in point 2.
- Structural Economic Problems: Issues like an aging population and low productivity creates negative growth expectations for the future.
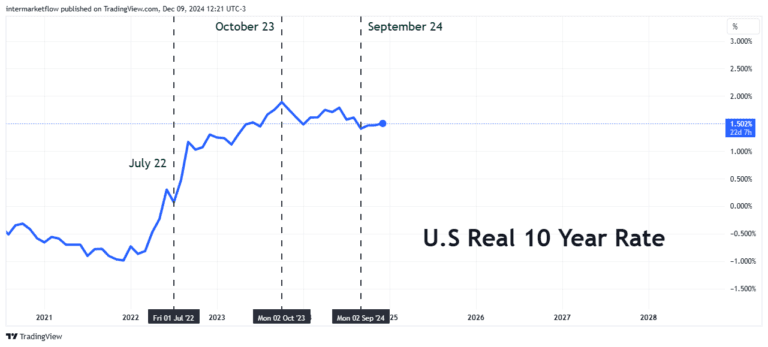
10-Year Real Rate
Real rates, currently at 1.5%, are driving up asset prices—across all asset classes.
We believe this situation highlights structural problems in the economy.
Let’s analyze defensive options.
To explore defensive positions, please refer to the next blog article (30b). This content is exclusive to subscribers.
If you’ve read this far, thank you very much. We hope you enjoyed it.
You can find us at intermarketflow.com or on X.
Martin
Intermarketflow.com
- Intermarketflow