#48 Overshooting, Economic Fluctuations and trading opportunities.

How do you trade in this kind of environment? What we’re seeing now falls under what we know as herd behavior. And contrary to what many believe, this type of behavior follows identifiable patterns—and can be highly profitable. These are the rules of the game now. We know how the opposing team plays—now it’s just […]
#47 Before we begin—here you´ll find:
The State of the American Consumer and Why a Correction Is Imminent. #47 Current expectations of the American consumer—and the trades they’re generating, at a systemic level. We’ve already looked at this from the perspective of real and disposable income—over six months ago here. Now, let’s examine it through the lens of current consumer expectations. […]
#46 Interest rates: The heart of the financial system.

Understanding the directional effects they create is essential for making sense of the markets. We can think of global capital as a fixed amount of capital—what changes are the stops where it temporarily settles. Nothing in the markets moves in isolation; everything is interconnected through interest rates. Components of an interest rate: ꭆ(n)= ꭇeal ꭇate(n) […]
#45 We are entering Stage 4 of the Macro Narrative

We believe a new macro narrative is now dominating the market, centered around future economic growth expectations.We see this as the start of a bearish trend, not just a market correction. This means a return to trend-following trading systems but in opposite direction.
#40a) Inter Market Analysis update, it couldn’t be clearer.
Here you will find a complete inter-market analysis as of today for:
1 Rates, in the different sections ot the curve. (Bonds)
2 Stocks.
3 Commodities.
4 Currencies.
Conclusions from analyzing the 4 mother categories.
#38 The small banks: risks and threats they are facing
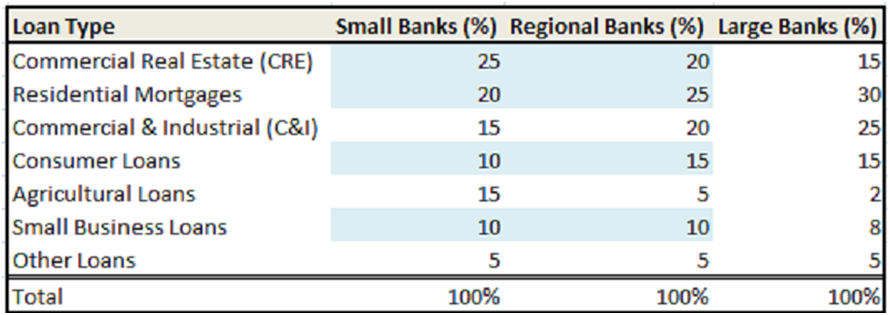
Here you’ll find a complete technical setup: volume, trend, momentum, and mean reversion. Entry and exit zones are clearly defined. This aligns with or is a consequence of the macroeconomic analysis presented in the previous article.
#34 A Guide to Understanding Macro Narratives in Trading.

Here you’ll find:
The relationship between macro narratives and the markets.
The evolution of a macro narrative.
The typical price behavior at each stage of the narrative.
An intermarket analysis covering the four categories to see how we’re starting 2025.
A technical setup derived from the analysis and aligned with our macro view.
#32 Trading movements in the two year real yield.

In this article, we analyze the 2-year nominal rate from September 18, when the rate cuts began, to December 18, which marks the most recent cut to date. We break down the nominal rate to understand what happened with its components: the real rate, inflation expectations, and the term premium. The conclusions are compelling.
#30 10-2 Year Yield Spread: Impact on Bonds, Rates and Trades.

In this article, we delve into the 10-2 year spread. We explore how it works, why it’s a leading indicator, and how it relates to other indicators derived from the yield curve.
#29 10-Year Real Rate Trading: A Complete Guide

In this article, we break down the components of the 10-year real rate. We understand what has been driving its movements since September up to now. We study the evolution of the term premium and the intermarket repercussions it generates.