Intermarket Analysis Throught Macro and Technical Methods
Shorting Consumer Discretionary Sector
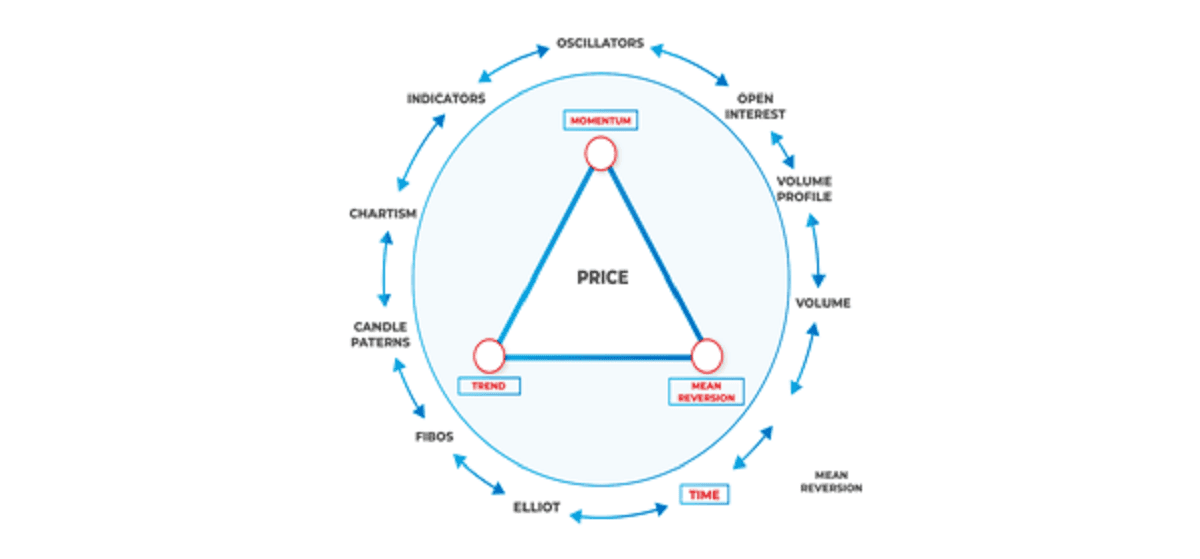
Developing a set up: Trend, Momentum and Mean Reversion the three main dimensions
In Technical Analysis
Trend and Price Location within the Trend
The big picture provides us with an overview of the current price situation. We can start to infer the trend states, momentum, and mean reversion probabilities.
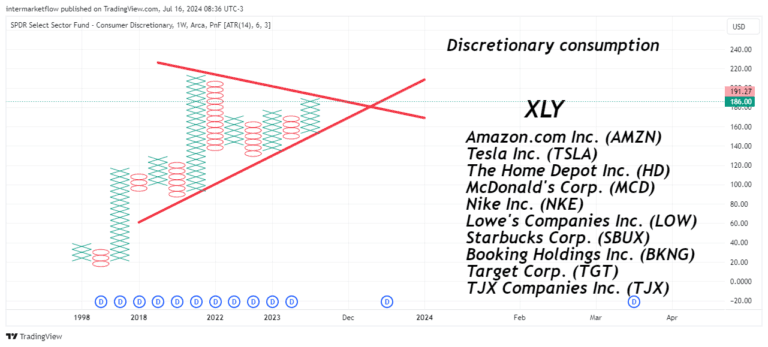
Focus on Price: Point &Figure Charting
To observe the “pure” price, we exclude the time factor from the analysis. This gives us a clearer understanding of the asset’s real trend and it´s force.
XLY is an ETF which mimics the consumer discretionary sector.
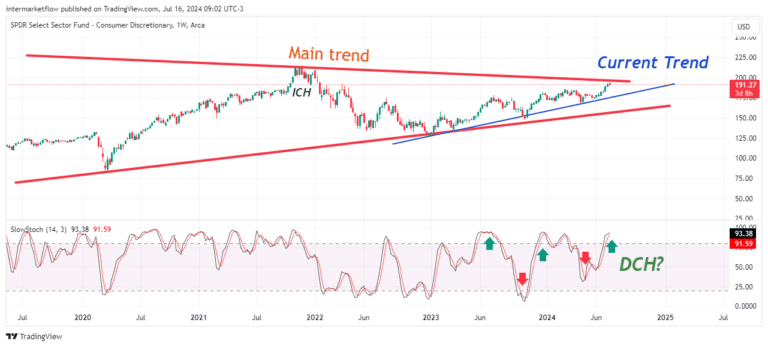
Main and Current Trend. Not the same thing!
Current Trend Force: The chart speaks for itself. Volume=Force
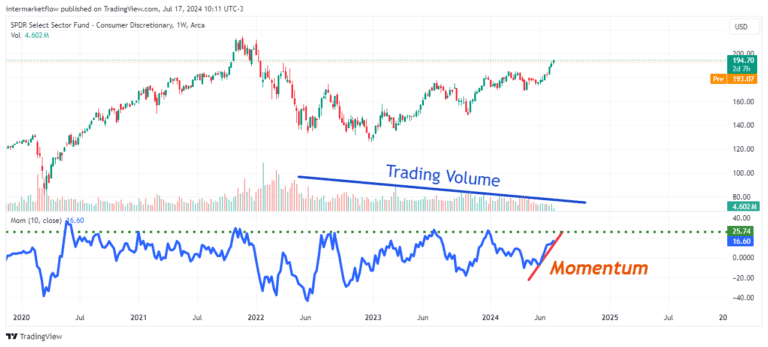
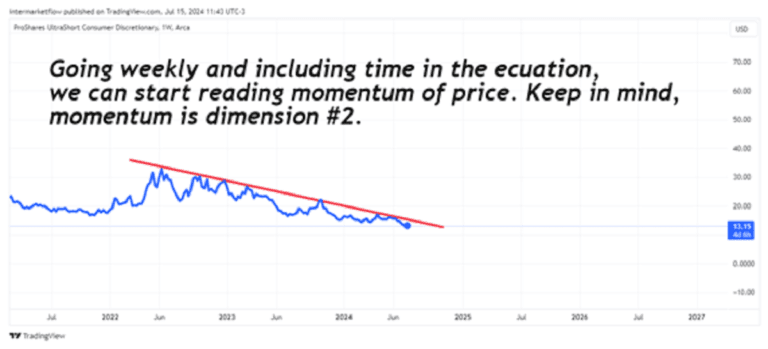
Momentum: Including Time
It’s not about the value of an oscillator and/or indicator. It’s about knowing how to “read” charts.
We have a finite and narrowing market. In this context, it is rising due to its current momentum, which is reaching its maximum levels relative to itself. The table is being set.
Mean reversions
Including time in the analysis, charting in Japanese candlesticks. The state of mean reversion and the over/under extensions. Two methologies among many oders.
Cycles
DCH? ICH? In the making
Staticstics
Overextended. Too long and too narrow. Sharks smelling blood.
Where fundamental and technical analysis connect.
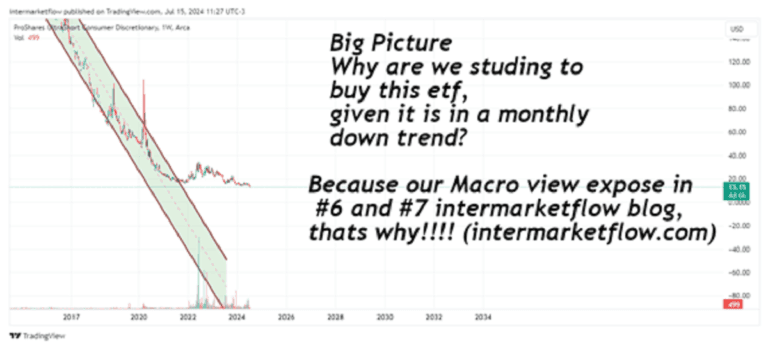
We have a state of situation. We have developed a macro view here. We have a direction and a sector, now we need the vehicle to express all of this.
Choosing the Vehicle - Trading Leveraged ETFs
Leveraged ETFs come with an additional cost. They are very expensive to buy and hold. The timing and position size are related through the asset’s volatility. We trade ETFs because they encompass sectors, diluting specific risk through diversification. We seek exposure to a macro sector of the economy, not an individual stock.
Proshares Ultra Short Discretionary : Inverse ETF x 2 of the discretionary consumer sector.
Including the time factor in the chart, we can start to read the price’s momentum. Although the trend is bearish, it is losing strength and encountering resistance. This could be a distribution zone, an accumulation zone, or both. We don’t know yet. Could a new macro narrative be entering the market?
Searching
Divergences
Monitoring Pattern Formations
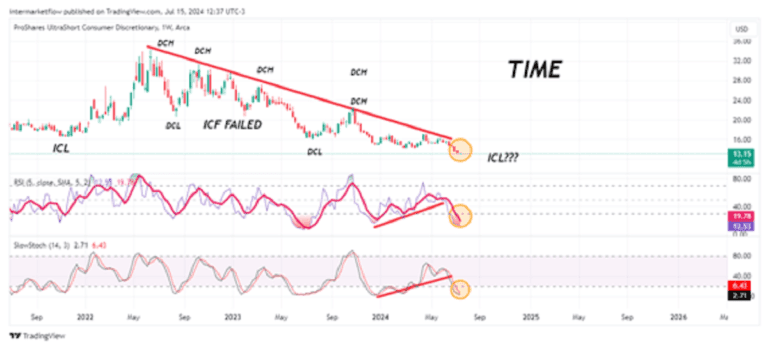
Many interpret the triangle as a continuation pattern, and it is. However, its main virtue is timing. When will it happen? There is a wedge forming with advancing price compression. Early in the party. The deadline for confirmation is July 2025.
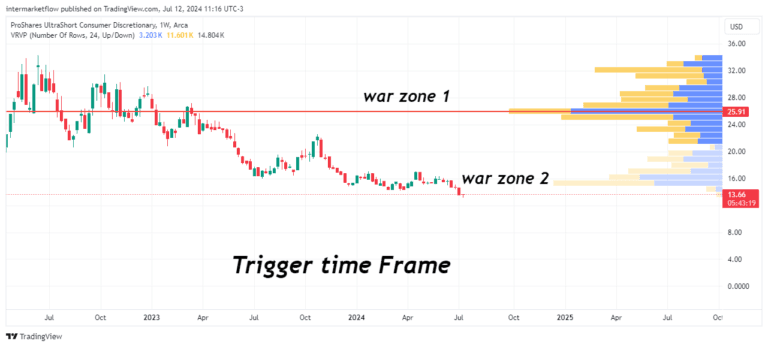
This is both a distribution and accumulation zone. Volume increases within the limited activity. Two clearly marked price zones serve as supports and resistances.
Key Support and Resistance Zones
More…
The price is deflating like a balloon. The volume is dropping too! Eventually, the sellers run out. The table is set.
Time
It’s still early. The price should be consolidating a new cycle low. It’s not far from doing so.
Remember SCC inverse ETF.
Oscillators Clarity/Cycles.
Volume and Volatility
We are entering calm waters, relatively speaking. It’s been a long time since there was a storm! Read the market. Interpret it.
Mean Reversion
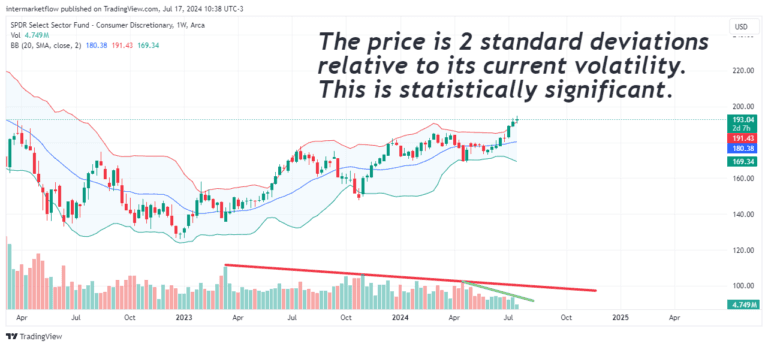
There is an overextension of the movement in the weekly time frame, statistically relevant relative to its recent past.
Price vs. Previous Prices
Weakness in the divergence, the overextension in the absolute value of the oscillator.
Conclusions: Several and very clear.
Big Picture: We are in a downtrend, which is struggling more and more to sustain itself across all time frames.
Daily and Weekly: The downtrend is being tested, with no confirmation of a breakout yet.
The formation of the wedge gives us insight into momentum, timing, and potential entry points for a trade.
Value zones are established.
Volume and volatility are low relative to its history.
On a weekly time frame, it is overextended by 2 standard deviations from recent movements, even with low volatility. This is a strong point in favor of a trade, statistically significant.
Momentum is rising but nearing its peak.
DCL or ICL in the making
Timing is Everything
If you were to trade this asset today, there are two ways to do it.
Option A is much much, riskier. Option B is the one indicated by Technical Analysis. In a leveraged ETF, where “storage” costs are high, B is the safer path.
We are on standby!
Macro View Integration: Why Shorting the Discretionary Consumer Sector?
Election year, volatility, politicians, shootings—everything comes into play. We know we are right.
It doesn’t matter!
It only matters when the price proves us right. There’s nothing more frustrating than being correct and watching an “irrational” market hit your stops.
Been there, terrible place to visit.
As always, I hope you enjoyed it. Subscribe, share—it all adds up and is much appreciated. Take Notice: Subscribers recibe set ups like this one every 7 to 10 days.