#105 Sunday Strategy: The Liquidity Mirage & The Credit Fracture
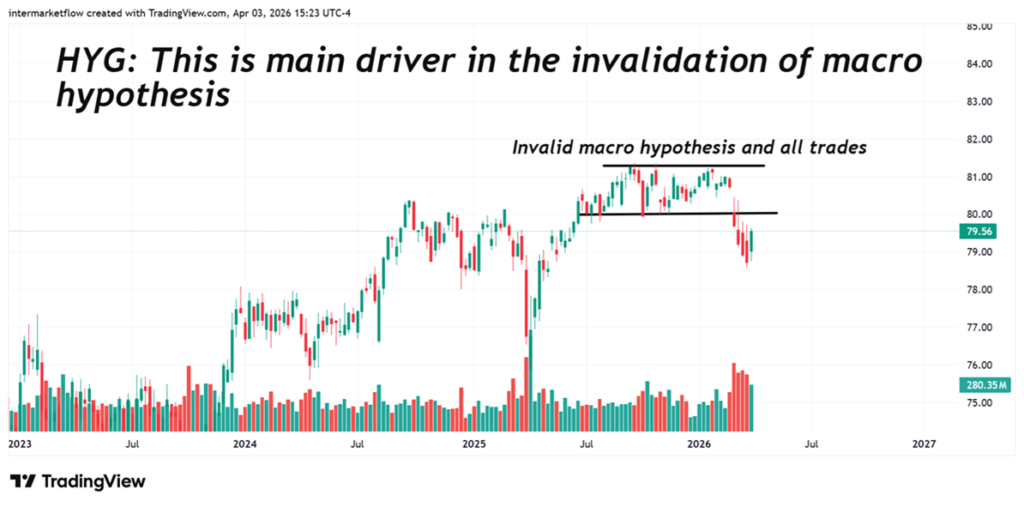
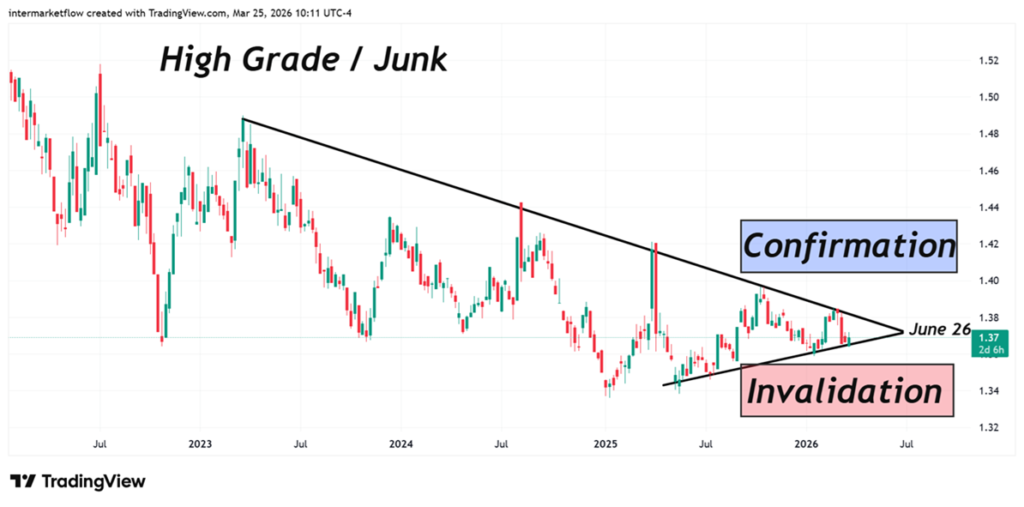
Like a flock of swallows, capital is no longer running—it is clustered on a single tree, parked in ultra-short duration debt. This Sunday, we dissect why the SPY’s $2.09\sigma$ move is a hollow mirage and how the widening divergence between JEF and FITB confirms the structural rot in the credit markets. The system isn’t recovering; it’s redistributing risk before the break.
#103 Duration Risk vs. Credit Risk — Where is the trade?
Duration and Credit risk are a transition that moves through the real economy as the shift intensifies
#102 Capital Flows: The Credit Risk Awakening
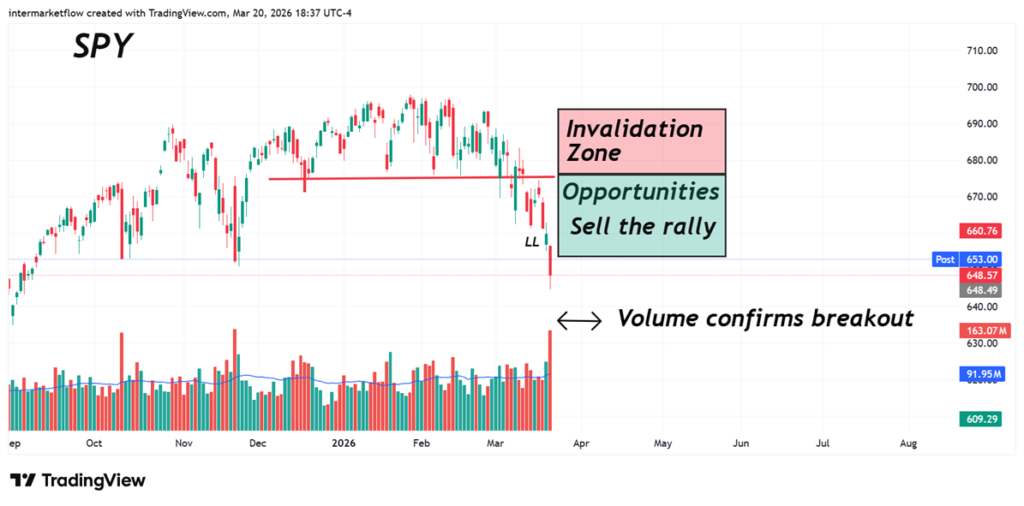
The market has pivoted from duration fear to credit panic. We analyze how Capital Flows are aggressively exiting junk bonds and equities to seek refuge in USD liquidity and crude oil. The record breakout volume in SPY validates the start of a new regime of extreme volatility.
#100 Midweek Report: From Banking Fragility to the Structural Breakdown in TOL
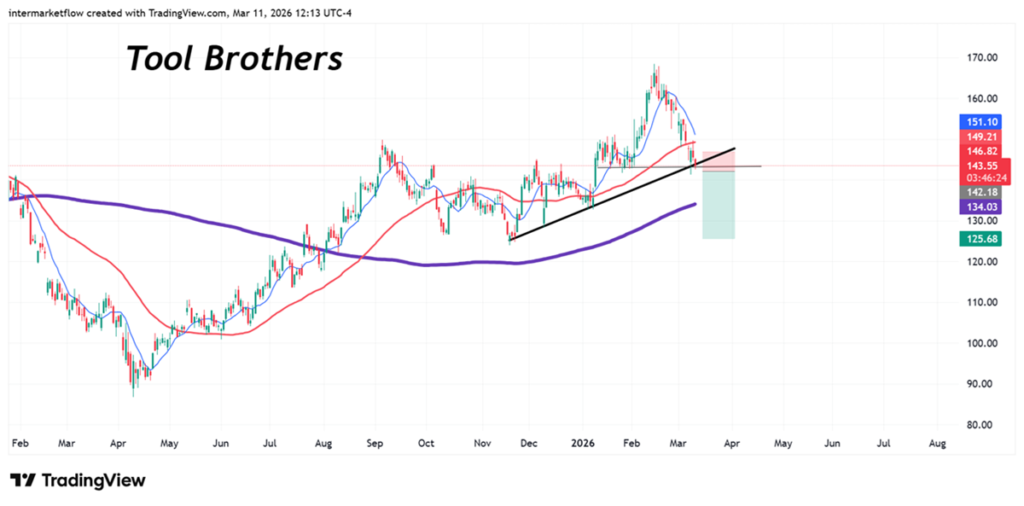
While the consensus remains paralyzed waiting for a Fed pivot, a statistical anomaly of 8.64 Standard Deviations in Crude Oil volume has just shattered the ‘Soft Landing’ myth. The USD Liquidity Vortex is no longer a forecast—it is an active regime of systematic deleveraging. Toll Brothers (TOL) is the first structural breakdown in this new reality. Access the terminal to execute the 142.00 trigger before the window closes.
#98 Intermarket, Flight to Quality, and Cash is King
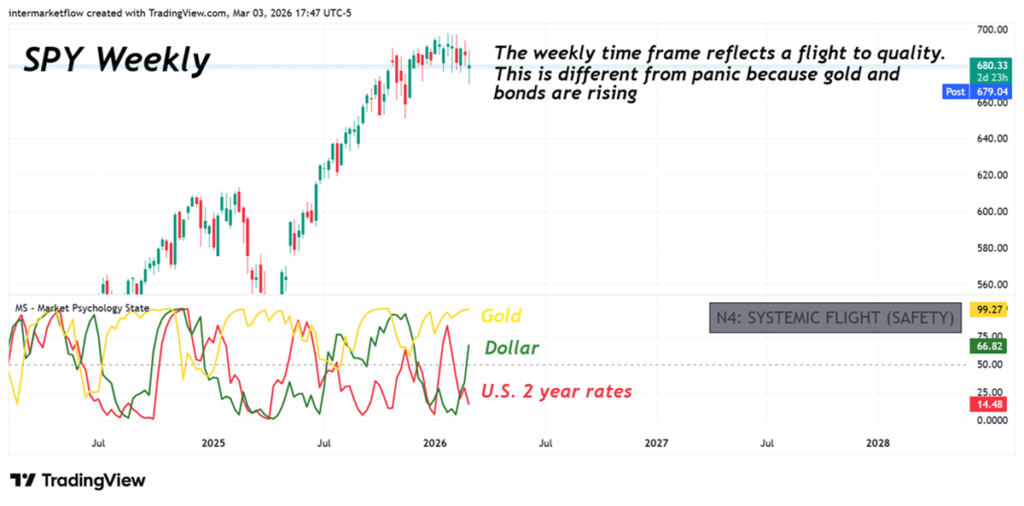
This report analyzes the current Intermarket dynamics behind the recent flight to quality. By observing the interaction between equities, bonds, gold, and the dollar, we identify the signals that define this Intermarket flight to quality regime and what it implies for market positioning.
#97 Intermarket Signals: Capital Flight from US Beta to Global Alpha
Intermarket Signals point to a structural capital flight from US beta. While Fed liquidity masks a cyclical collapse and creates a bull trap in the S&P 500, smart money is aggressively repositioning into Swiss Franc safety, Korean semiconductor alpha, and Brazilian real yield. Read the full Sunday Verdict to map the rotation.
#95 Intermarket Trading Strategy: Risk-Off and the US02Y Correlation Breakdown.
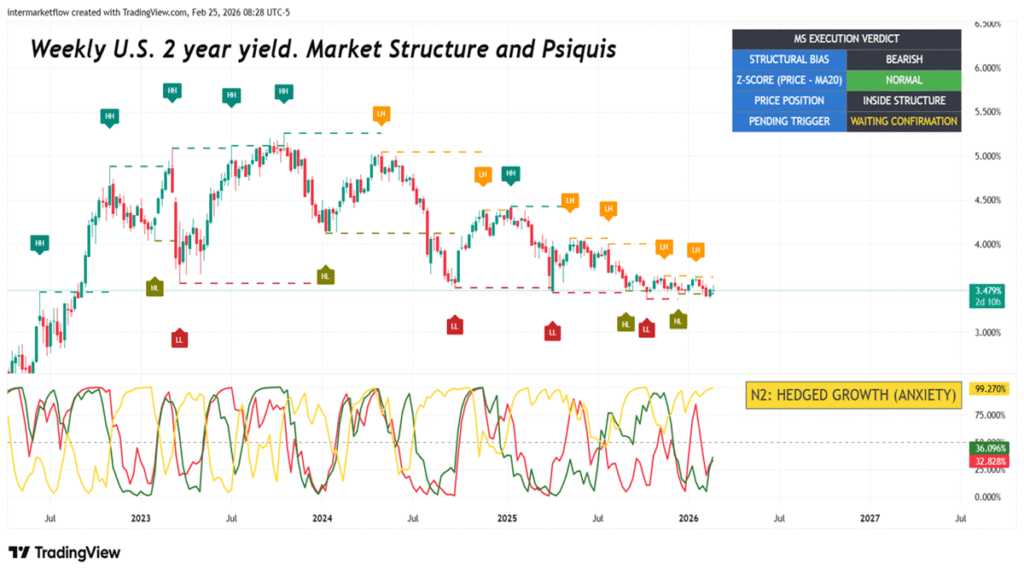
We use intermarket analysis to describe, anticipate, and trade. The Dollar, Gold, the 2-year yield, and the sectors that test our hypothesis.
#94 The SOFR Breaking Point: Navigating the Dollar’s Structural Squeeze
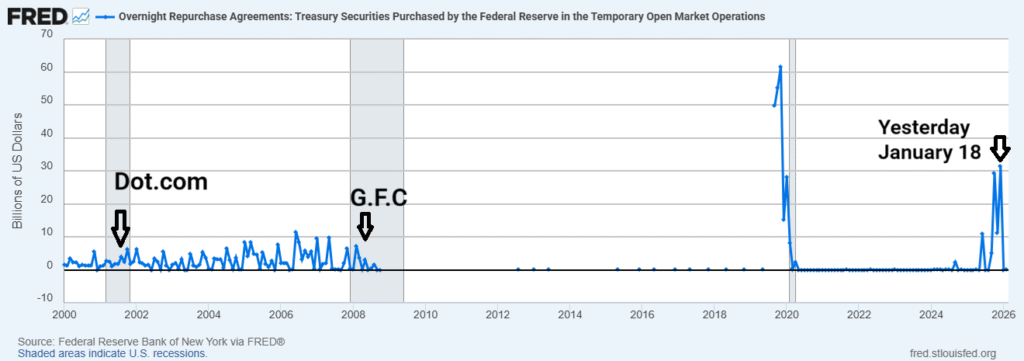
Liquidity has not vanished; it has been relocated. While the market is distracted by the “soft landing” narrative, the system’s plumbing is undergoing a structural stress that most are choosing to ignore. This report analyzes the critical transition from the Reverse Repo (RRP) facility into captive bank reserves and explains why the current growth model has officially entered a solvency trap.
#93 FINANCIALS DEFENSIVE REGIME: THE MATH IS BROKEN
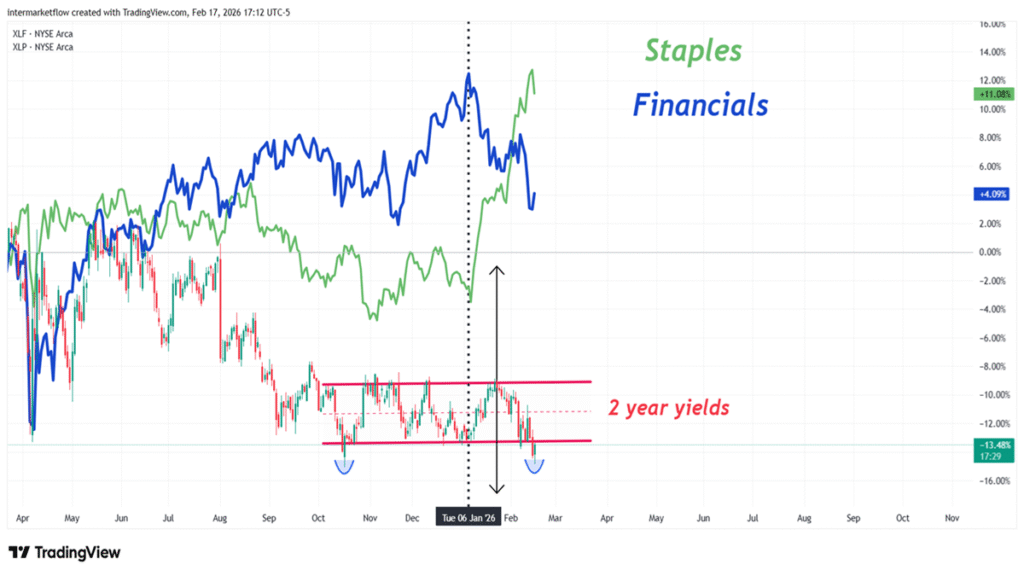
Lower rates are signaling distress, not stimulus. Discover why the Jan 7 pivot redefined the XLF regime and get the full WFC trade box setup (Target: 76.5).
#91 Context and Follow-Up: QQQ & IWM — From Sunday to Today
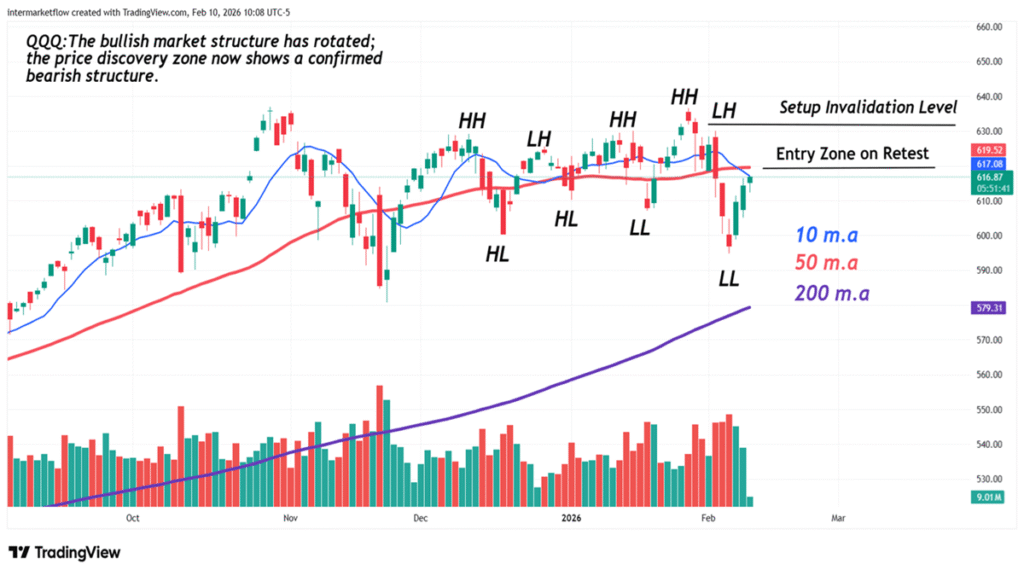
We analyzed which correlations shifted over the past month—and in which part of the curve.
What we found in Small Caps, Tech, and the 2-year yield was striking.