#85 The Real Economy: Winners, Losers, and Injured Players
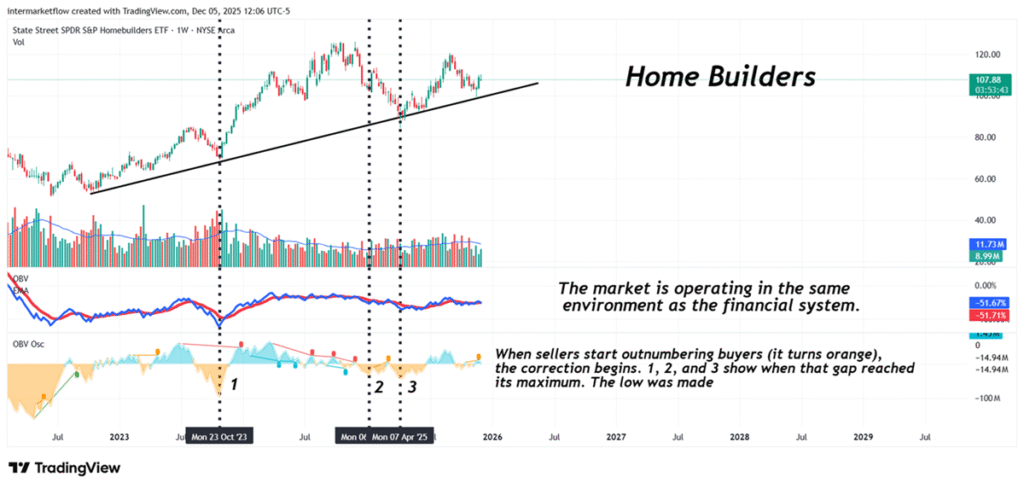
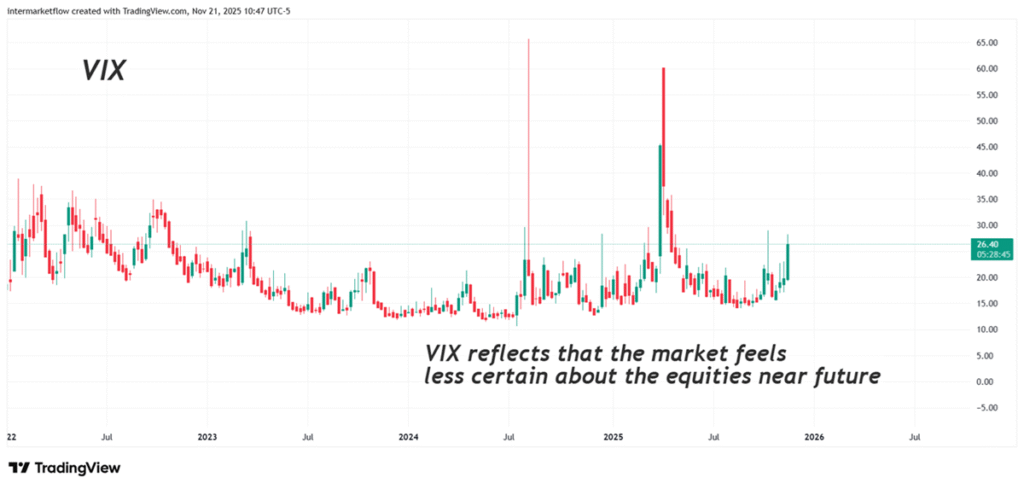
The real economy and the context we are trading today.The VIX: a historical perspective on current levels, with a specific comparison to the Dot-com and GFC recessions.The real economy and divergent reactions within the financial and homebuilding sectors.
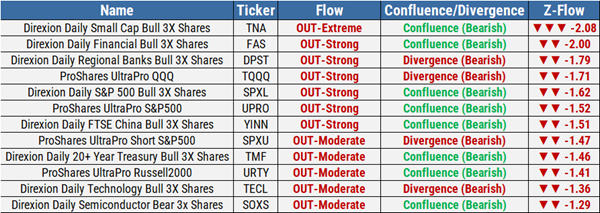
Intermarket flows: the same winners remain in control.Intra-market analysis: segmentation to see what headline data hides.The health of the AI trade.
Sector-by-sector relative performance versus the S&P 500.
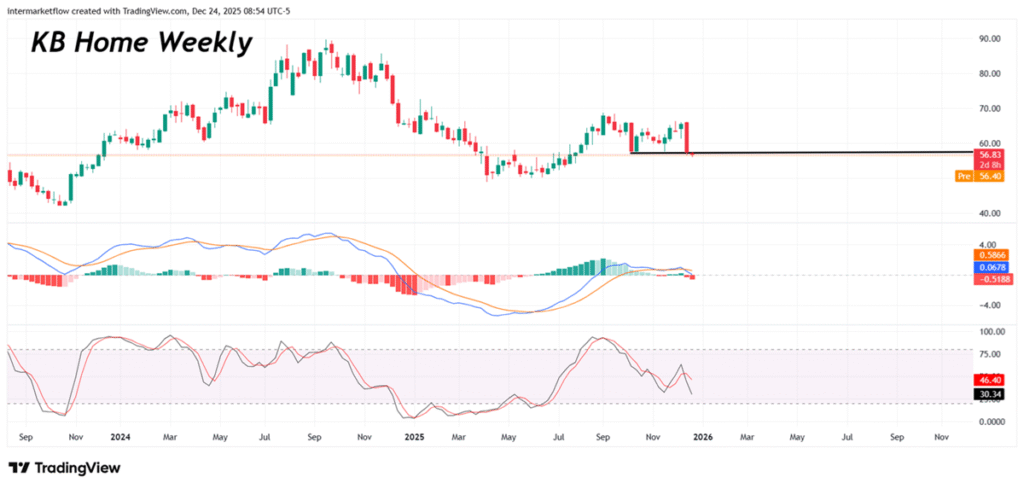
Relative strength within the homebuilding sector, identifying specific vehicles.
Home Depot and KB Home: wounded prey on the open plain.
#84 The discretionary delusion and the market’s stance. Three vehicles to track.
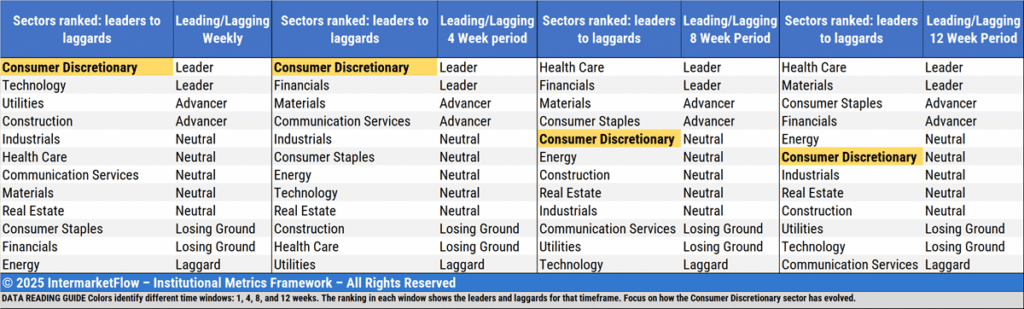
We break down retail sales and why Consumer Discretionary is completely detached from reality. We picked three vehicles to go deeper, while tracking how risk-takers positioned themselves this week.
#83 Unemployment, Macro Cycles and Sectors
A historical perspective on unemployment—its levels and the current trend relative to past cycles. Its connection to sectors, and how sector leadership evolves as the cycle matures. We then zoom in on two sectors in search of vehicles to trade.
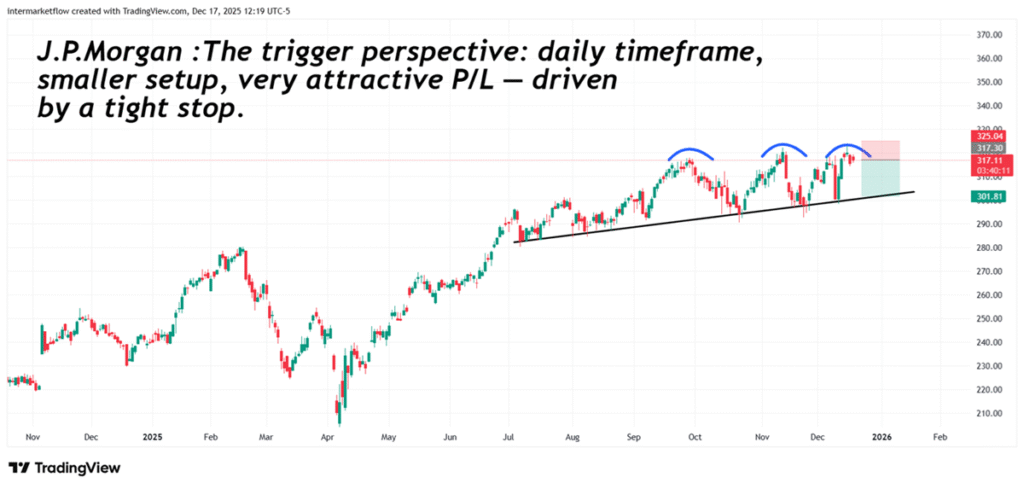
#81 Feed meeting: On your marks, get set… go
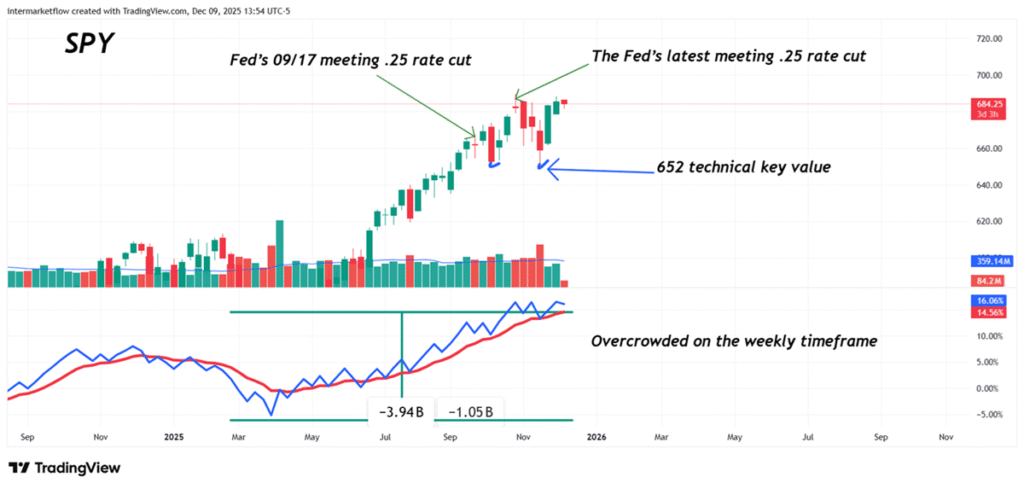
The Fed meeting is acting as the catalyst. Here, I read the messages the S&P 500 is sending across different timeframes. Too clear not to hear.
#80 End of QT ≠ QE.
We analyze the end of QT and the rate cut scheduled for next December 10. Which mechanisms must reactivate for it to transmit into the real economy, and the scenarios ahead. Why we believe we could see a “buy the rumor, sell the news” into Wednesday, and the three stages of a correction scenario.
#6 QT, Liquidity and capital flows around the world
We analyze QT from different time perspectives. We dive into the concept of liquidity as applied to different sectors. What it can solve and what it cannot. A complete intermarket capital flow tracking, sub-categorized to refine the analysis. We look at the weekly positions of risk takers.
#79 Equity Assets: A global paralysis

Equity assets Across the world, they’ve gone into hibernation. There isn’t a single asset class that has received inflows as a sign of confidence ahead of the upcoming rate cut. Volume — the only real confirmation — signals paralysis. And in that context, returns are irrelevant. Equity Assets: To kick off this piece, the first […]
#5 Mid-Week Technical Analysis: Stagflation Captured in Two Charts
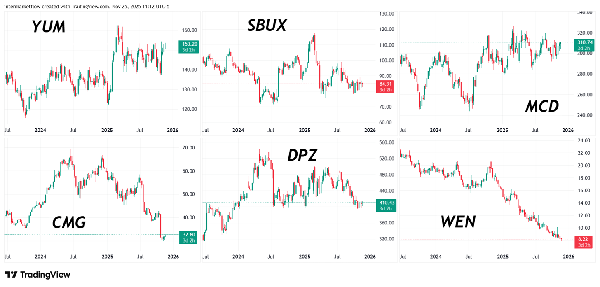
We describe how a stagflationary process hits different sectors at different moments. With two charts, we show an economy in stagflation. We also break down the SP500 and the six largest fast-food chains from a purely technical perspective.
#78 Cross-Asset Signals Hint at a Valuation Regime Shift
Last week we saw that there’s one variable that can truly destabilize markets: uncertainty. Here You can’t touch it or see it—but you can feel it. And even though it’s intangible, the market expresses it in many ways, across different assets. Uncertainty can encompass everything—when the whole system trembles—or focus on a single category. It […]
#4 Technical Analysis: Sector Profile, the Methodology for Trading an Emerging Correction
The technical methodology for trading pullbacks. Selecting the right sector, beta profile, and company size in line with a macro hypothesis.