Macro Economic Conclusions: Latest Insights on Economic Trends and a trading set up
Targeting the Real state Sector.
Based on the macro fundamental analysis we conducted here, , we have we reached several arguments for targeting the Real State Sector.
Stock Market Trends and Defensive Strategies
Despite the grandiose news about new highs in the stock market, beneath the surface, a defensive stance is on the move. The market is reflecting this situation in several variables, most notably the trading volume in the long end of the yield curve and the price of gold. Both assets serve as safe havens. This is happening at a time when there is an all-time historical record of available funds in money markets. This capital, parked at 5%, will eventually change destination. The current market information indicates that it is positioning itself defensively in risk-off mode.
Probability of Interest Rate Cuts: Declining Inflation Expectations
Based on current information provided by de F.E.D inflation expectations are plummeting. Excellent leading indicator for fed funds rate, as we se here The market today assigns a 56% probability of a rate cut at the September meeting.
Average Timing of Upcoming Recession
Tools
- The start of an easing cycle.
The average time from the start of rate cuts to the next recession is 9 months, as we saw here . The sample extremes range between 15 and 4 months. Rate cuts haven’t started yet, but it’s good to keep these parameters in mind.
- Yield Curve Inversion
To date, we have had an inverted yield curve for 24 months. It seems like a lot, but if we look at history, we haven’t reached the average yet, which is 27 months. The extremes of the last four recessions ranged between 26 and 33 months.
- Importance of the 30-Year vs. FED Funds Rate Spread
The spread between the 30-year rate and the F.E.D funds rate is a powerful indicator with a stellar track record. When the difference between them reaches its maximum negative point and begins to recompose, a recession is very near—100% effectiveness. As we saw here, this scenario doesn’t seem far off.
Historical Data and Projections
It’s important to note that all these indicators come from the core of the market. They don’t involve data collection or data entry, and they aren’t subject to sampling errors or human error. They are market prices—visible, transparent, and available to all agents. These prices, like all prices, reflect all the information available to date and are adjusted as new information enters the market.
Correlation of the 10-2 Year Spread with F.E.D Rate
This is the most closely watched spread in the market. It directly influences the expectations of all agents. Notably, its correlation with the F.E.D funds rate is at historic highs. This is simply unsustainable. The breakdown of this correlation will signal the entry of a new macro narrative into the market that does not align with the F.E.D’s.
Real life, the one that happens in homes and streets
Real Income vs. Real Disposable Income Trends are two trains heading in opposite directions. The severity of the situation lies not only in their direction but also in the fact that the growth rates of both variables are opposite. Real income is growing at a constant rate, while real disposable income is decreasing at a higher but negative rate. It’s as if one of the trains is accelerating toward the collision.
New Job Positions and Consumption Impact
The most real-time reports indicate that while job creation is positive, its current growth rate is slower than in the recent past. This also imposes a deadline on consumption growth rate.
Private Sector Credit Slowdown
The F.E.D is doing its job. Monetary tightening is slowing down the creation of private credit and so, slowing down future consumption and production. This will result in reduced consumption, production, and future investment.
Credit Card and Consumer Loan Debt
If we analyze aggregate consumption, it continues to grow at constant rates. However, this is being achieved by pushing consumers toward the worst type of credit: credit cards and consumer loans. These are the most expensive types of credit.
Stagnation of Non-Durable Goods Consumption
Despite all this, the consumption of non-durable goods has stopped growing. This reflects an initial stage of the real consumer because government spending does not influence this demand.
Government Spending and Stable Consumption
Government spending, in an election year, is undoubtedly supporting aggregate consumption. This is reflected in the current data.
Government Spending as a Risk Factor
This factor is quite easy to anticipate. After all, politics has this bias, especially in an election year. It can certainly sustain and delay the economic cycle. It’s not free and has both internal and external, present and future, economic implications for the United States.
A.I
This factor is difficult to measure. Like the internet in 2000-2001, the future implications of this technology are simply incalculable. As happened back then, everything reacted so quickly that the explosion was inevitable. Predicting these things seems easy in hindsight, but ex ante, right now, it’s not so straightforward.
Targeting Real State
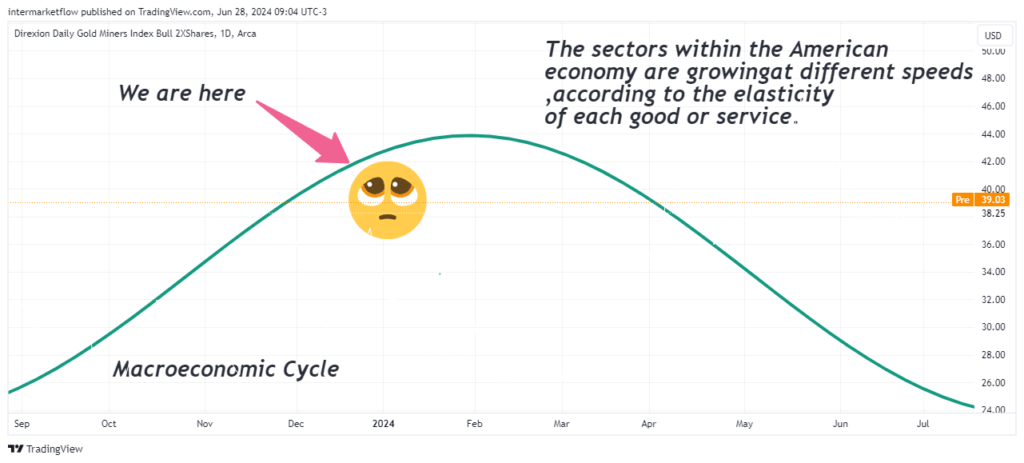
Not all sectors perform equally in this part of the cycle. The elasticities of each particular good interact. Some sectors are more exposed to a slowdown, and some collapse in a recession. Others, however, serve as safe havens. This is considering equity, but as we saw here, there are several more issues to analyze.
M.M and M (Money Markets Mountains)

Additionally, we are starting from an initial stage with capital highly concentrated in money markets. This asset is primarily dependent on interest rates. We know that it won’t be long before rates drop. We know the economy is slowing down, and therefore we know where to look. Whether in the equity spectrum, bonds, currencies, or commodities, the butterfly effect will be felt, as we have seen here.
Portfolio Management
- Rotation of assets in their main categories: stocks, bonds, currencies, and commodities. Including geography en economic perfil of each case
- Within the American economy, it determines the rotation towards more suitable and profitable sectors in an economic slowdown.
- Outside the United States, rotation to other types of economies and currencys.
- The defensive situation seen in the market also determines rotations towards other assets and sectors more suitable in recession scenarios.
Aggressive Moves in American Equity: Targeting Real State
We are targeting the sectors of:
- Real Estate
- Discretionary Consumption
- Financial
- Technology
In that order, with varying levels of aggressiveness. Not everything is the same. Volatility varies, and more importantly, the current market craze for some tech stocks makes them practically unviable to attack for now. We will wait attentively, but we are keen on shorting them.
Defensive Moves
Some of these moves have already been made, generally involving the long end of the curve. In addition, we are looking at the typical defensive sectors:
- Health
- Staples
- Utilities
Technical arguments for shorting rading the real state sector
Real State
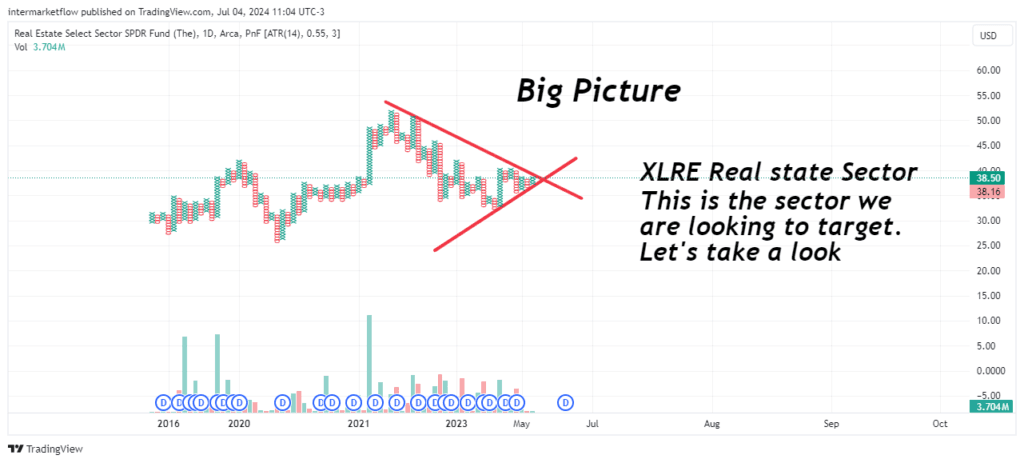
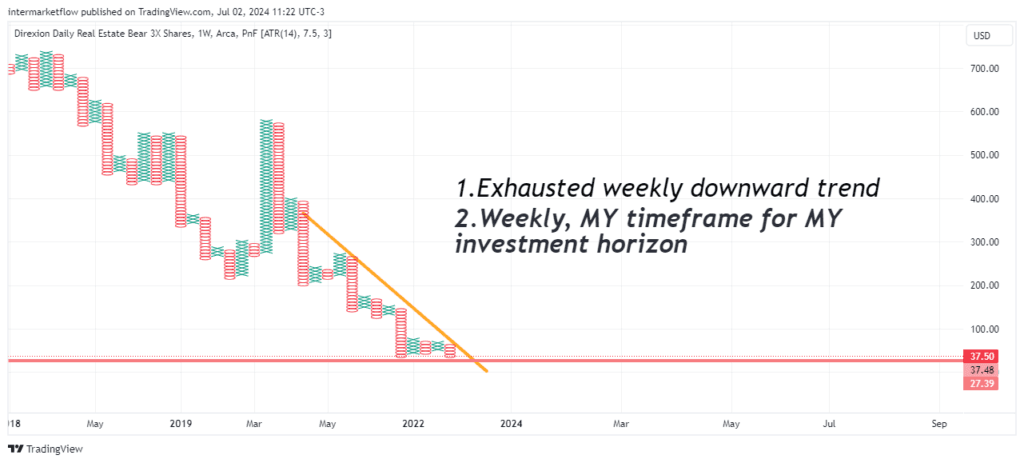
P&F is a tool that removes time from the equation, allowing us to focus solely on price. It has been on the rise since October 2023.
Vehicle
- Direxion Daily Real Estate Bear 3X Shares You can see the composition and objective of the ETF here: DRV ETF Summary
A few notes before presenting:
- This is extremely aggressive and therefore extremely risky.
- It’s very expensive to maintain over time.
- Position sizing must be done carefully.
- It must be consistent with your investment horizon.
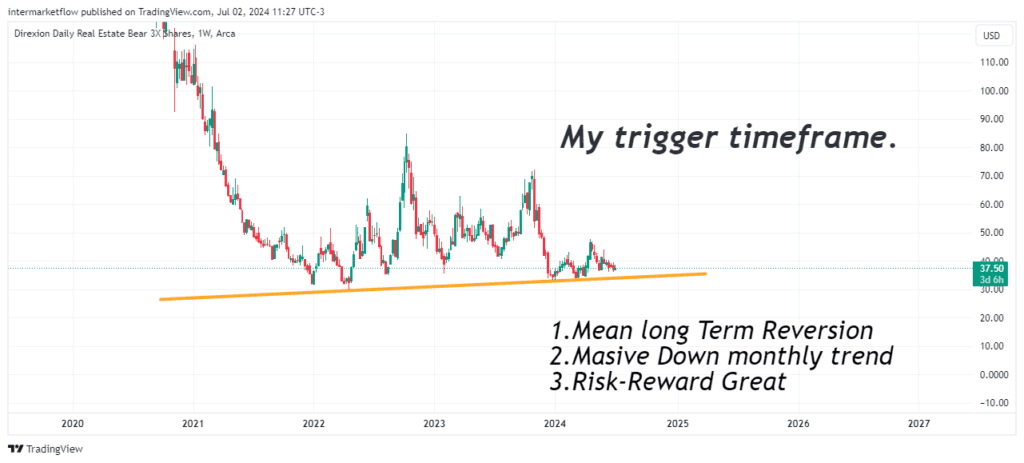
Methods
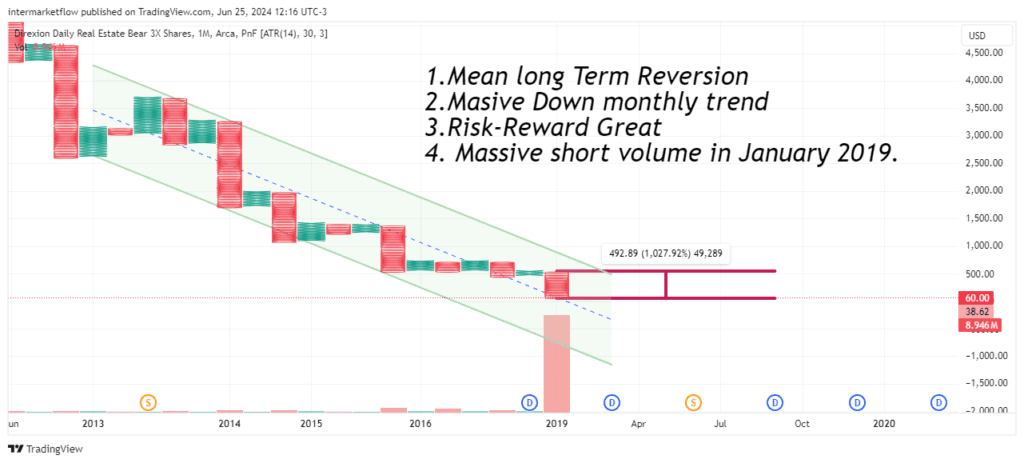
Once we switch to candlestick charting, which includes time, we can see the asset from another perspective. The speed changes and volatility increases, an unequivocal sign of indecision. An uptrend is confirmed with four tests in the monthly time frame.
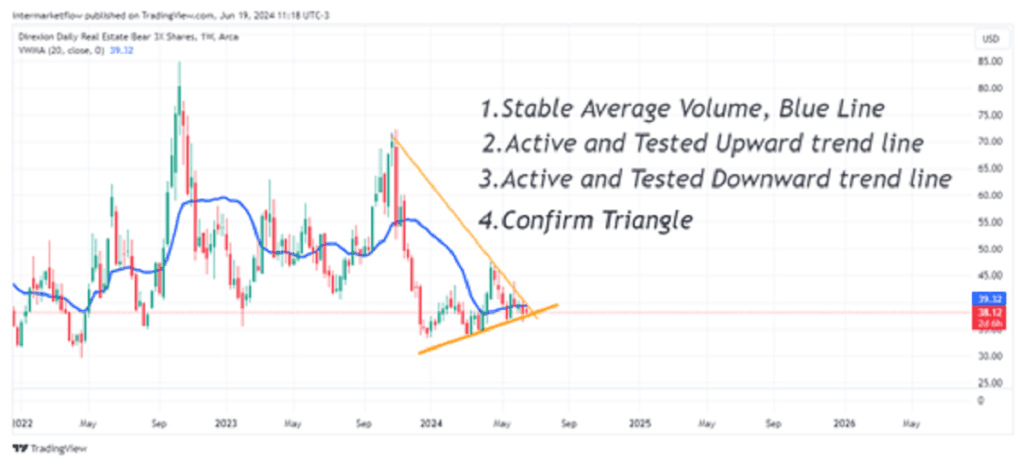
Time Techniques

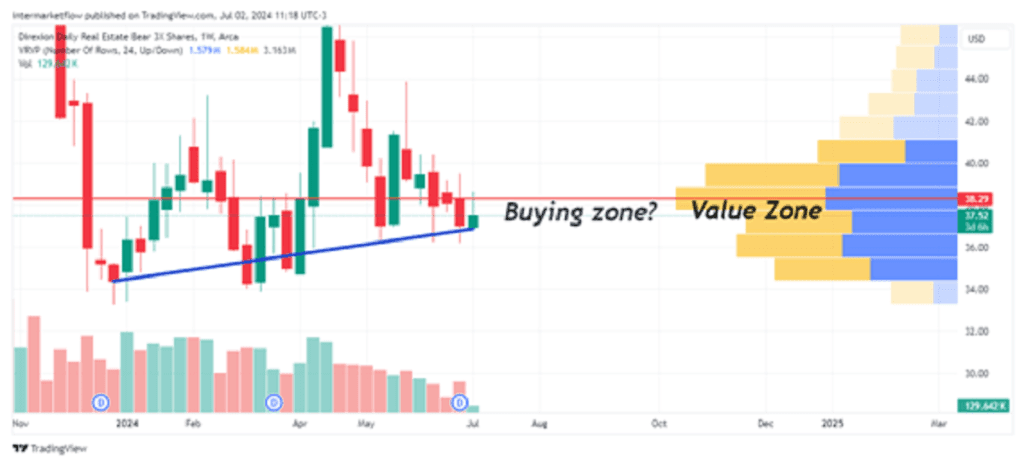
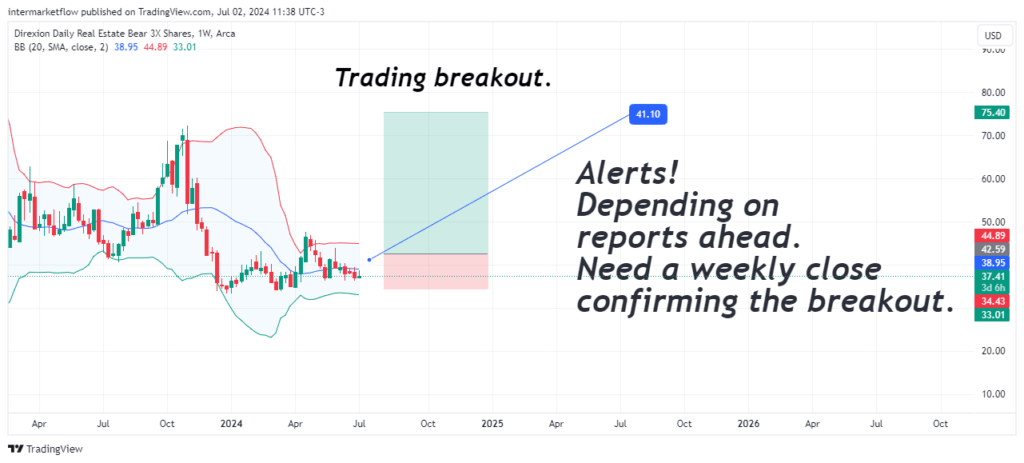
Weekly Time frame-Decision Time frame for us.
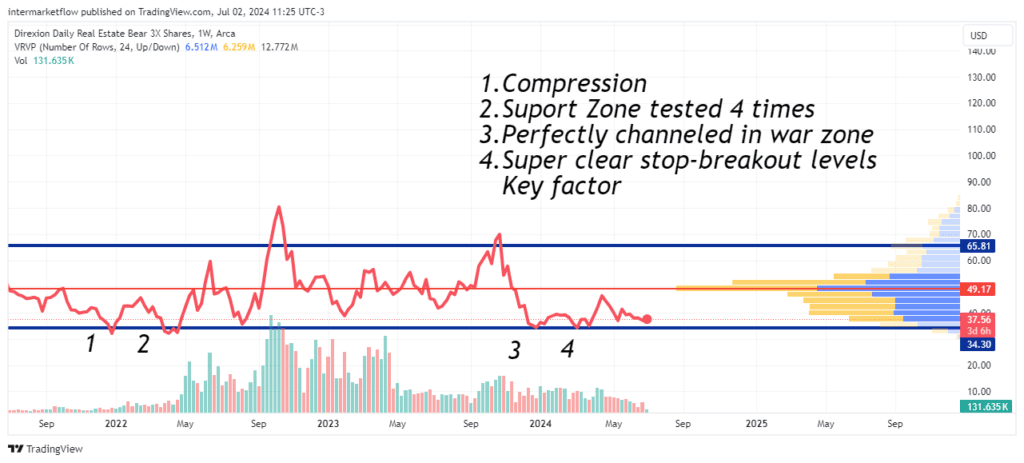
Breaking down the time into weekly frequency and observing only the closes, we see a completely channeled asset. The battle zones, value zones and breakout points are super clear. This is very important for us. We know where we’ve lost. It determines the position size, given the asset’s volatility. Remember, DRV x 3. Another important dimension is analyzing the market’s stance on value. It’s very concentrated. The paths of least resistance are longer paths.
Weekly in candels.
Value zones are by definition, war zones.
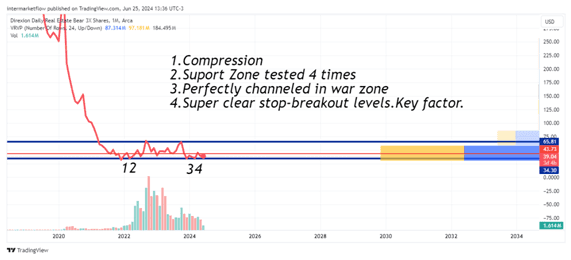
Weekly P&F
Returning to P&F, we see the compression and a clear support zone.
Week. Getting Close
Zoooooooming. So close
Weekly
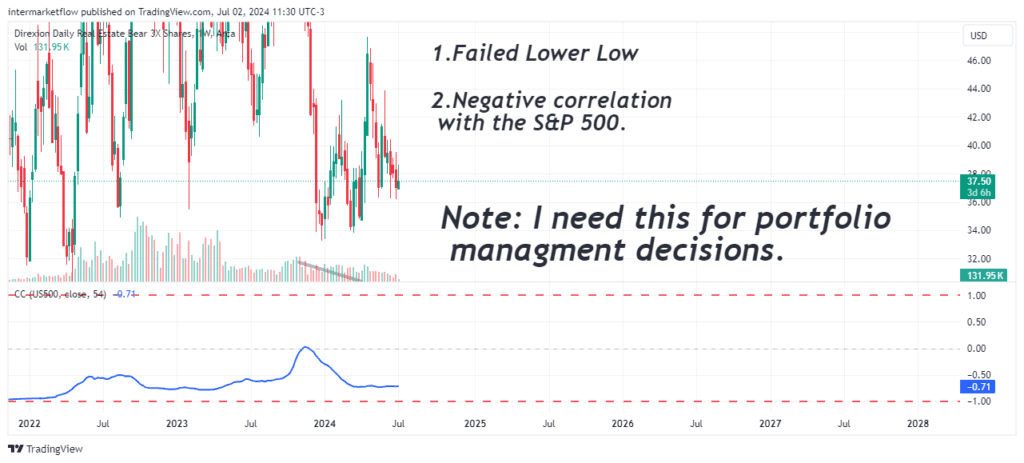
Negatively correlated with the S&P 500. This is crucial for us. It’s exactly what we need.
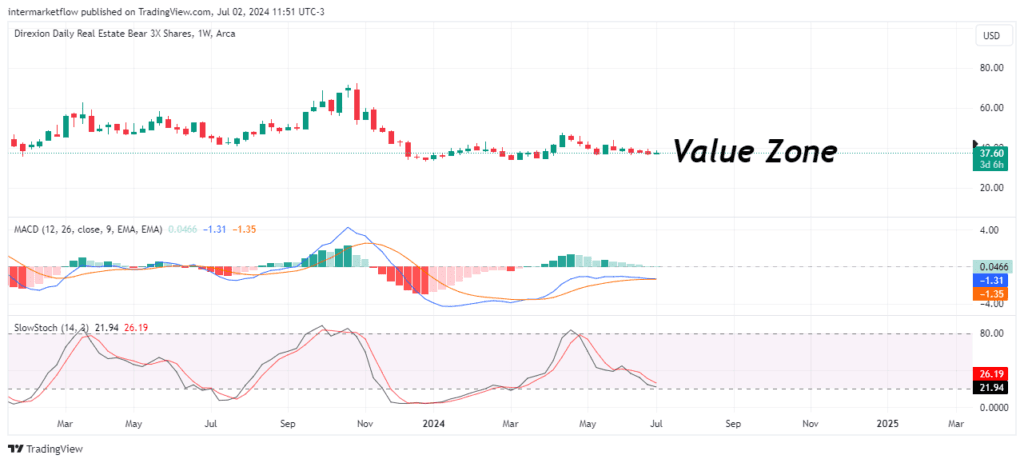
Deeper: Oscilators
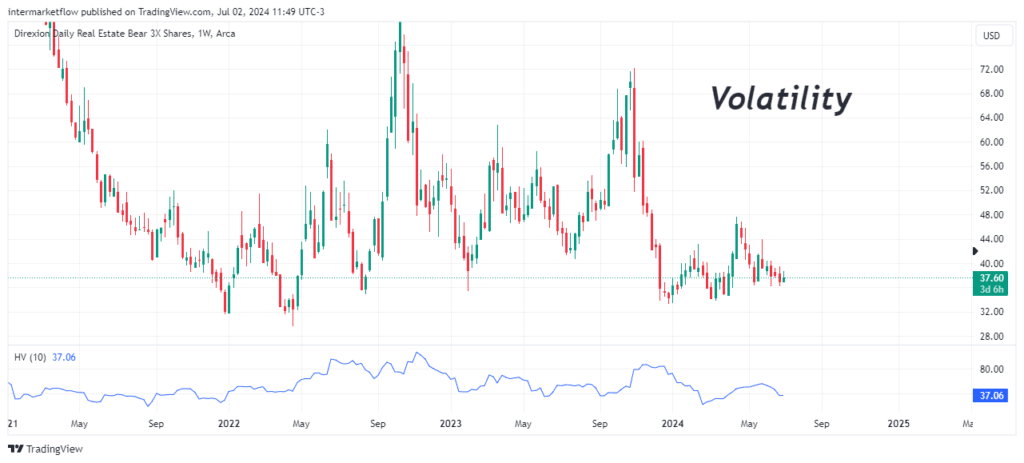
Another Dimension: Volatility vs Historical Volatility.
We are in a period of low volatility. This provides potential strength and, in some ways, reduces risk. We are entering calm waters, for now. It’s not the same as entering a storm.
Shooting: Targeting Real State
This is where styles come into play. There are two ways to trade this. Both have their pros and cons.
Technical analysis is a trend-following method. Books suggest that we should trade the break. However, waiting for that break often creates a larger loss zone, requiring you to reduce your position size. In our case, we make split entries, using both styles and dividing the initial position into two. The first, been much more risky. More on technical Analysis here.
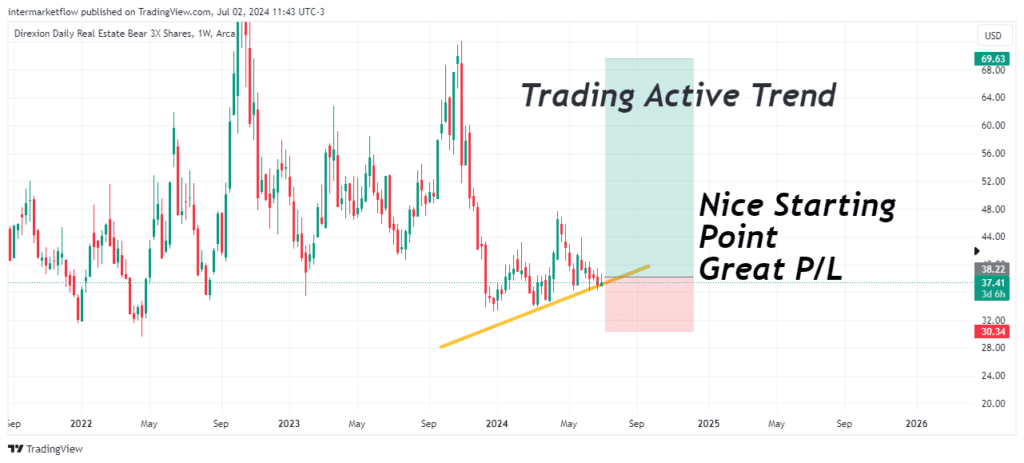
This is the format of our newsletter: macro conclusions + setups we have developed or are developing. I hope you liked it. Believe it or not, it took nearly seven reports to conclude this hypothesis. Know that, like this setup, we are considering between six and eight more. This was our favorite, and we already have one foot in the door.
For those firms and consultancies subscribed to the newsletter, welcome. Don’t hesitate to contact us, as we have advisory business relationships operating in several countries already.
I take this opportunity to welcome some friends from Russia. добро пожаловать. I hope you eventually bring some good vodka.
As a final favor, I ask you to share the report. It costs you nothing and makes a big difference to us. By the way, fot those kind enough to share, you´ll recieve, another set-up just like this one, straight to you inbox. You can contact us by this mean. We will respond as soon as posible
Keep in touch
Martin
Intermarketflow.com
- Intermarketflow
Intermarket Analysis LLC
703 Waterford Way - Suite 805 - Miami, Fl 33126
Unlock Full Access
We create professional content for traders, based on intermarket, macro, technical, quant, and flow analysis.
Welcome aboard — enjoy the ride.
If you have already registered before, please enter your email again to recover your session.
One Response