#24 Exploring the world of Currencies
Part 2 of several to come.
Let’s continue with the analysis we started here. For those just joining, we are searching for currencies that could become recipients of the dollar-denominated cash currently parked in money markets. To give some perspective on where we are starting from:
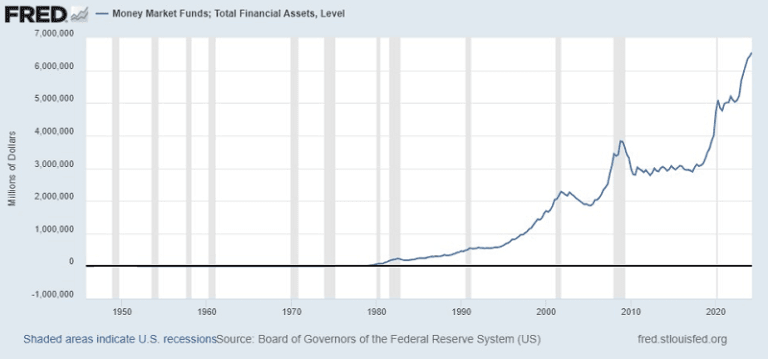
These funds are receiving a 5% return, denominated in dollars, with zero risk. This is a historic record never seen before. If you look at the chart, the last two times this metric peaked were during the Dot.com crisis and the Global Financial Crisis (GFC).
Currency Markets Options.
With this in mind, we analyze the currency market to identify those that could become attractive in the short term. These high rates won’t last indefinitely (in a credit-dependent economy), and eventually, they will decrease. As they do, more attractive currencies and returns will emerge, becoming receiving centers for this capital.
Several Types of Currencies.
- Safe Havens (JPY, CHF, Gold).
- Store of Value (Euro, CHF, Gold).
- Currencies dependent on international and national trade, depending on the case and the population of each country (INR, SGD, MEX).
- Commodity Currencies (CAD, AUD, BRL, CLP).
- By geographic zone: North America, Europe, Asia, Latin America, Africa, Oceania.
Several currencies meet the criteria or could fit into more than one category. We’ll explore this as the article progresses.
Global Macro Cycle, Currencies, and Commodities.
The global economy that emerges will directly and indirectly impact the strengths and weaknesses of each currency.
Commodities as a Leading Indicator of the Global Economy.
To analyze expectations, we will use futures contracts. Their prices reflect market expectations based on the information available today. We are using the next second contract available, expiring in March 2025, which gives us a longer-term view of what the market expects in the future.
Bloomberg Commodities Futures.
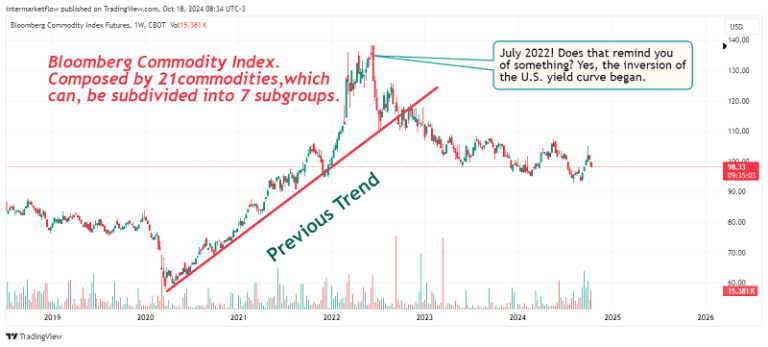
This index groups 21 commodities. It’s curious that the trend change occurred in July 2022, which is the same month the U.S. yield curve inverted.
We break it down to understand relative forces.Commodities have the unique characteristic of being denominated in dollars while being globally demanded and produced. Therefore, their prices speak a “global” language, reflecting supply and demand. In this case, since we are looking at futures for March 2025, the prices reflect the market’s expectations today, in October 2024, for supply and demand in March 2025.
Let’s divide into 4 groups:
• Energy Commodities
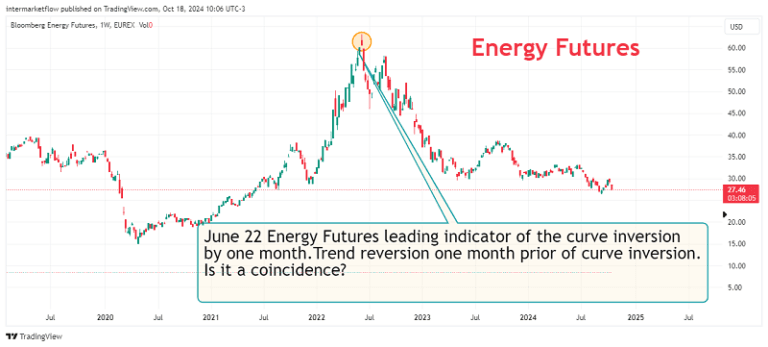
Once again, the trend change occurs, in this case, a month before the yield curve inversion.Falling energy prices imply, by definition, lower economic activity. In this case, it’s not just about the U.S. economy but globally. These global expectations already position several currencies either with a tailwind or a headwind.
Industrial Metals Futures.
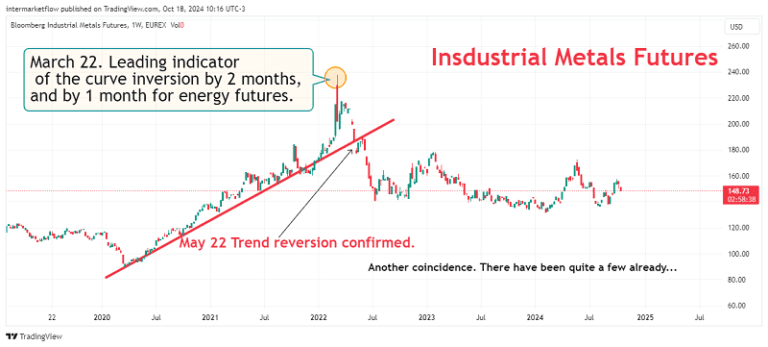
It’s almost identical to the previous chart. In this case, the trend change occurred two months before the curve inversion. The message is the same: falling industrial metals indicate lower industrial activity, and therefore, lower economic activity.
Grains Futures
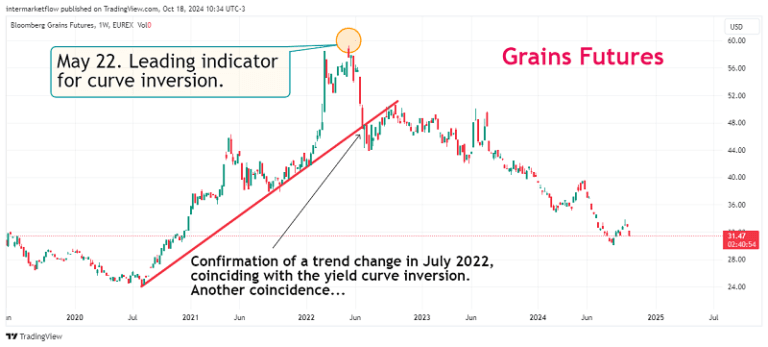
The story repeats itself. There’s an abrupt trend change in the same month the yield curve inverted. Another group of commodities directly tied to economic activity.
Energy - Industrial Metals - Grains: Consolidating Information
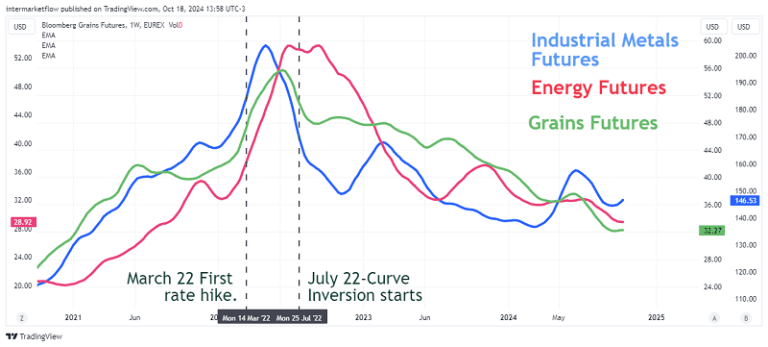
March 2022, first rate hike.
A few months later, the commodities markets are already anticipating the slowdown that’s about to come. The first to anticipate the U.S. yield curve inversion were Industrial Metals, followed by Grains, and finally, Energy.
In the first article of this blog (here), we explored the leads and lags between the Bloomberg Commodity Index, the PPI first, and the CPI later.
Falling commodities as leading indicators.
For those new to the blog, I’ll repeat our main hypothesis:
We believe the U.S. economy will enter a recession between May-June and July, as the most likely dates, but it could happen anytime throughout 2025. This is not an unfounded or casual opinion. It is based on solid macro analysis, including:
- Yield curve analysis: Studying past behavior in similar situations, along with average leads and lags in each case.
- Three interpretations of the yield curve, as we reviewed here, and the average leading times for each.
- The situation of American disposable income (as seen here) and its relationship with the market, especially the discretionary sector.
- The state of the real estate market, particularly the new home market (covered here). We tracked building permits two years back and the subsequent sales, concluding there is an enormous and growing stock, exposing many real estate developers with poor inventory management.
- Mortgage demand and the current unaffordability of homes.
- The growth of different economic sectors, based on their elasticity and sensitivity to the macro context (covered here).
- The order in which sectors’ sales declined aligns with at least a slowdown.
- The weakness in the labor market, particularly the state of continuing claims since July 2022. There’s also low credibility in the payroll numbers.
- The prevailing risk-off environment in the market, as discussed here, despite headlines about new S&P 500 highs almost daily.
- Finally, we expect short-term rates to fall more sharply than long-term rates, which, as we covered here, will obviously have consequences on the real economy.
The main threat to our hypothesis is clearly government intervention through public spending and the resulting fiscal deficit.
This chart shows that the markets are not just expecting an American slowdown but rather a global one, with some particularities.
Comodities ex precious metals futures vs precious Metals futures
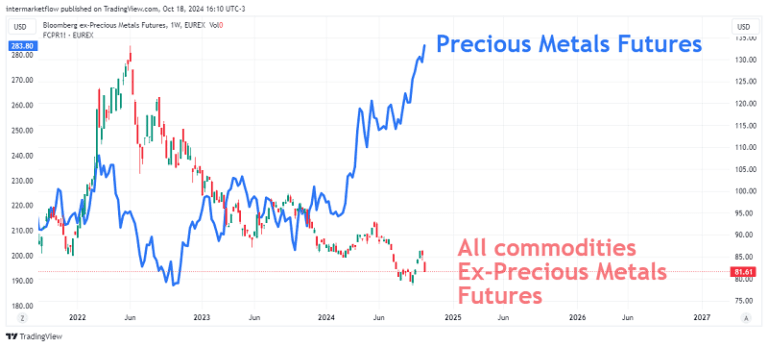
The market is not only seeing a slowdown but is also in risk-off mode with growing risk aversion. Consider that this gold rally is happening with rates hovering around 5%. In this context, some currencies should perform better than others. We can group market expectations into two parts:
- Global trade slowdown.
- Uncertainty around different safe-haven assets.
Of course, this market outlook has implications for trading across all asset classes. Every asset category presents vehicles to trade in this situation. At this moment, the time horizon and risk tolerance of each investor determine the category and vehicle to operate. It’s a time for portfolio adjustments.
Soft landing vs. Hard landing:Common aspects:
Both scenarios involve rate cuts.
Key difference: The main difference lies in how fast the rates fall, which will obviously have radically different consequences for the real economy.
Historical Safe Haven Currencies: Futures to March 2025
Indexed charts at 100% vs. USD
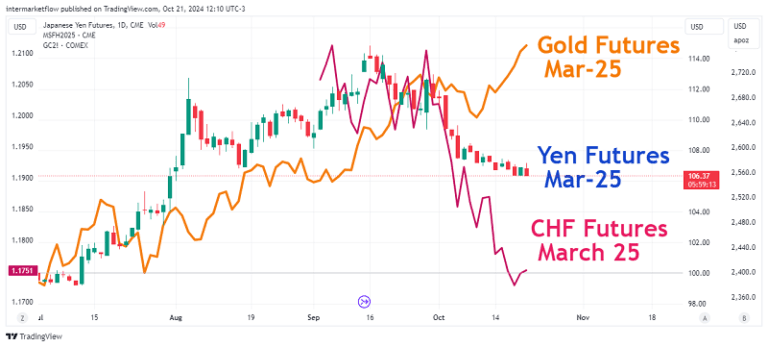
For March 2025, the market currently expects traditional safe havens, like the Swiss Franc and the Yen, to decline. This is inconsistent with the rise we’re seeing in gold futures and the prevailing risk-off environment. Historically, all three (Franc, Yen, and Gold) have served as safe havens in times of crisis. Additionally, gold plays the role of a reserve currency. All of this comes despite the interest rate differential heavily favoring the U.S. Now, this same rate differential is also working against gold, yet it continues to rise.
European Currencies: Futures March 2025.
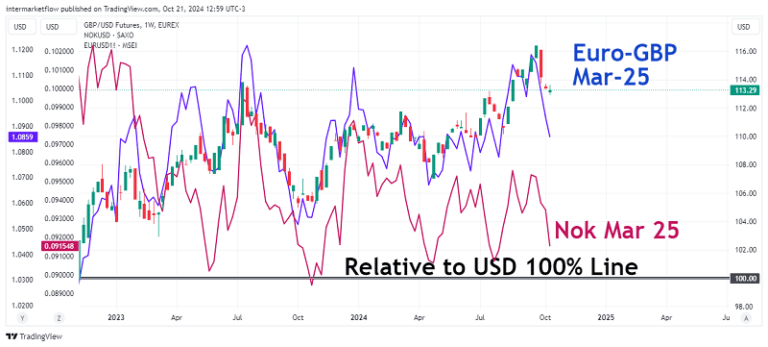
The main currencies of the Eurozone, despite having small interest rate differentials, are expected by the market to decline by March 2025.
Lastly, let’s analyze the dollar.
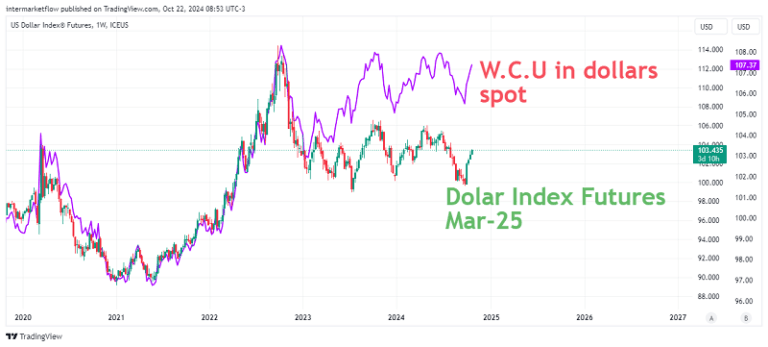
World Currency Unit:
Includes Asian currencies like China’s, whereas the Dollar Index does not. As you can see, both have distinct strengths, though they remain very solid when compared to the rest. This was expected, given the large rate differential in favor of the dollar and its undeniable role as a reserve currency
Trends: Strengths and Weaknesses.
Between the two articles, some conclusions are starting to emerge:
- Weakness in CAD and AUD. This is logical both in terms of interest rates and commodity prices. Of the two, AUD shows even more weakness, given that it failed to appreciate when one of its main commodities rose by approximately 40%.
- BRL also weakened, but much less so. It has a favorable rate differential that helped compensate for the extreme drop in its main commodity.
- The strength of gold, despite enormous rate differentials working against it, is striking. It’s capturing today’s risk-off flows.
The key question that arises is whether, as rate differentials decrease, CHF, JPY, or EUR can regain their status as safe-haven currencies. If they fail to do so, gold’s outlook improves even further.
We still need to add to this analysis the relative relationship between each currency and its main drivers, as well as their values relative to historical levels, both in price and volatility. This will be the subject of our next article.
In technical analysis, it’s much more important to understand where an asset won’t or can’t go. This narrows your options and leaves you with just the entry points to define.
Keep in Mind.
No other variable defines the real return of an investment like the correct decision on currency. It influences the returns of all other asset classes, making it the most important decision to make.As always, I hope you enjoyed this as much as I did writing it. That’s all for now. Please share this. The subscription won’t cost you anything, and it makes our day. You can find us at intermarketflow.com and on X @intermarketflow.
See you soon,
Martin
Intermarketflow.com
- Intermarketflow
