Intermarket Analysis Throught Macro and Technical Methods
#21 The Role of Intermarket Indicators in Trading.
Real-World Intermarket Applications in Trading Strategies.
Here you’ll find:
- Our methodology for tracking the evolution of the U.S. economy.
- A diagnosis of where it currently stands.
- A comparison with the Dot.com crisis.
- An intermarket analysis to identify the next destination for capital.
- A comparison of FIAT currencies since July 2022, when the curve inverted.
- An operational setup based primarily on intermarket, supported by macro, and triggered by technical analysis.
Action: Benefits of Using Comparative Market Data.
For a more concrete approach, we closely monitor the situation in real-time as a self-check of our macro view. We track the evolution of the American economy by monitoring capital rotation between sectors. These trends help us describe the current state of the economy and serve to double-check our hypotheses (more here). Check the last column that shows the sensitivity of each sector to a slowdown or recession. With 1 being the highest sensitivity. After this check, we move on to Intermarket analysis, looking for setups.
Trading Strategy
Macroeconomic theory: Theoretical perfect path towards a slowdown/recession.
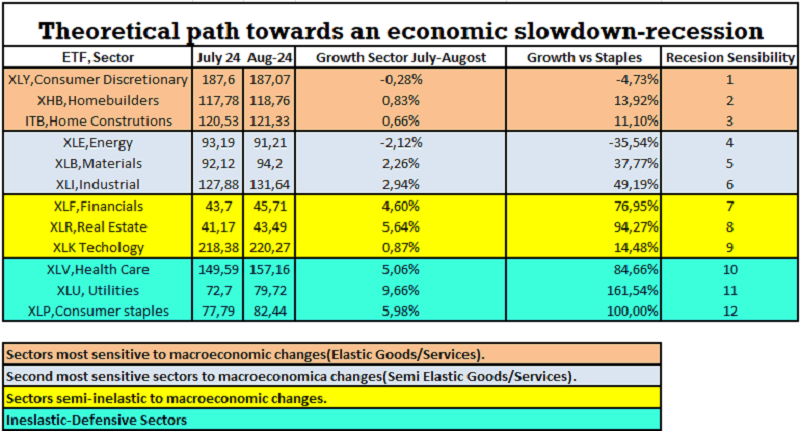
As a guide, the path to a recession typically sees capital rotating towards more resilient or defensive sectors, such as Utilities, Health Care, and Consumer Staples. Along the way, the more “elastic” sectors will be impacted to a greater extent, eventually exhibiting negative growth.
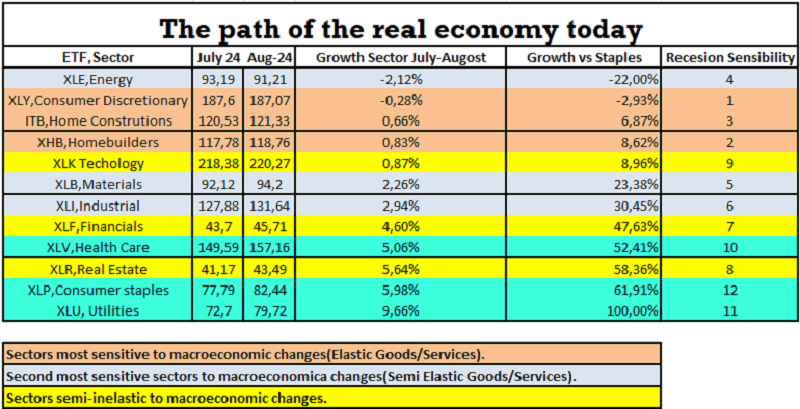
What’s happening today?
Real-World Intermarket Applications in Trading Strategies
Like a domino, each piece is falling into place. The path to a recession is nearly perfect. We even have two sectors already showing negative growth, and we know what that implies for employment. Our hypothesis remains intact, so we will continue trading based on it.
Dot.com Crisis: “History doesn’t repeat itself, but it often rhymes.” Mark Twain.
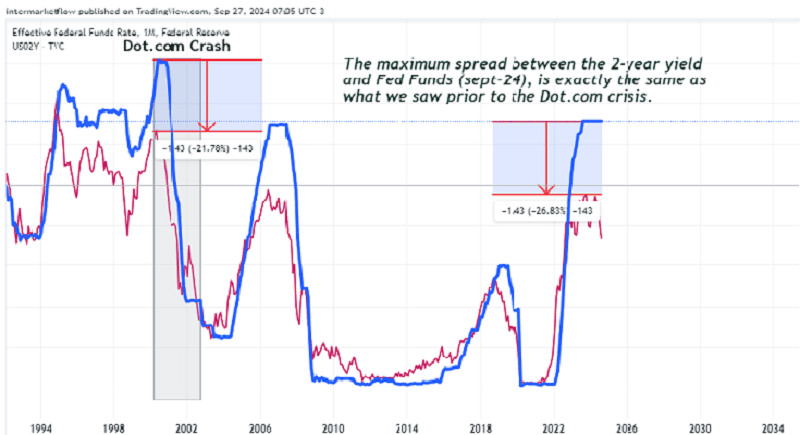
*Today is 27-9, and the chart uses a monthly scale, which is why the latest rate cut by the F.E.D. isn’t reflected yet.
The important thing to note is that the spread between F.E.D funds rate and the 2-year rate at the start of the Dot.com crisis and today are the same. I emphasize, literally the same.

The Impact of Bond Yields on Equity Markets.
Opportunities are emerging at the short end of the curve. Before moving on to the practical part of the report, I want to share an economic model I came across while researching for this report. It provides empirical evidence on the formation of interest rates.
Relationship between Productivity and Real Interest Rates:
- An increase in productivity drives investment, fostering optimism and expanding credit.
- If productivity fails to meet expectations, asset values decline, triggering a crisis and a collapse in real interest rates.
- While productivity initially drives rates up, a financial crisis can dramatically reverse this trend.
Conclusion: Productivity boosts real interest rates during the expansion phase, but the resulting financial crisis leads to a sharp decline in those rates.
Does this remind you of anything?
Combining Various Intermarket Indicators.
Intermarket Basis here

With the beginning of rate cuts, one cycle ends, and a new one starts, introducing new market dynamics.
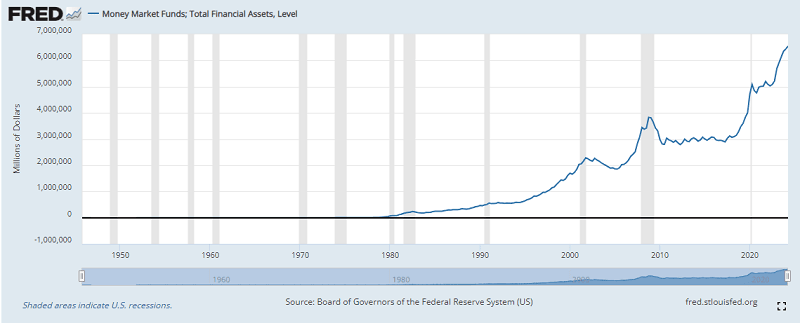
Initial Stage.
The Money Market is currently at the center, filled with dollars at historic highs. While this report is quarterly, the latest update was on September 12, 2024. Historically, every time this situation has occurred, it has signaled uncertainty in the markets. Take note of the relative peaks reached during the Dot.com and GFC crises.
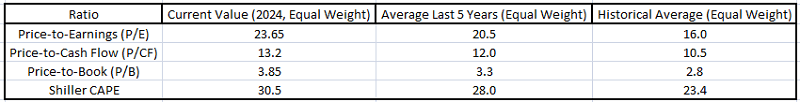
We know that U.S. equities are in a process of rotation towards more resilient sectors. We also know that, as a whole, they are expensive in historical terms.
- Take profits if you’re in U.S. equities or rotate into defensive sectors.
- If you’re in equities in other markets, whether developed, emerging, or frontier, you must be clear on your market’s beta relative to the S&P 500—the current,
historical, and crisis-period betas. - Shift to a risk-off state, which the market has been doing for some time now. We discussed this here a while ago.
Faster and larger short-term rate cuts compared to long-term rates imply:
- Direct impact on currencies.
- Direct impact on short-term bonds.
- Delayed effect on commodities.
Currencies-intermarket Analysis
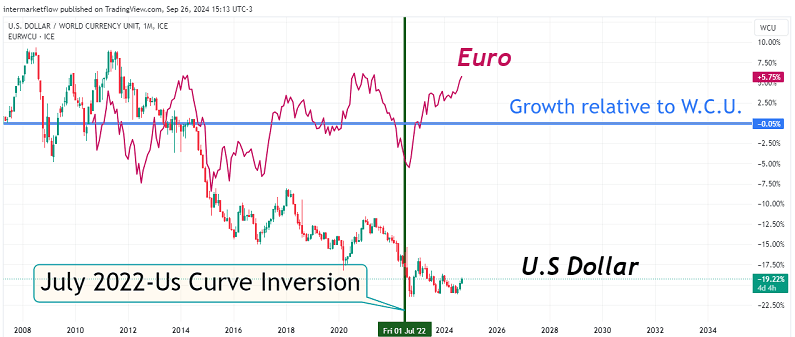
We start the analysis from July 2022, the point when the U.S. yield curve inverted using the synthetic World Currency Unit (W.C.U.) as the common denominator. It is a basket of currencies weighted by the relative size of each economy.
Euro-Dollar
The chart is on different scales, so it’s not useful for analyzing comparative levels. However, it helps observe the evolution of each currency post-inversion. The euro shows a clearly positive growth rate. In the case of the dollar, the inversion had virtually no effect. Its decline started much earlier and has been continuous. Are we witnessing portfolio diversification at the currency level? It makes sense.
Mexican Peso-Australian Dollar.
Nothing here. The Mexican Peso and the Australian Dollar don’t seem to have reacted or altered their trajectory in response to the inversion.

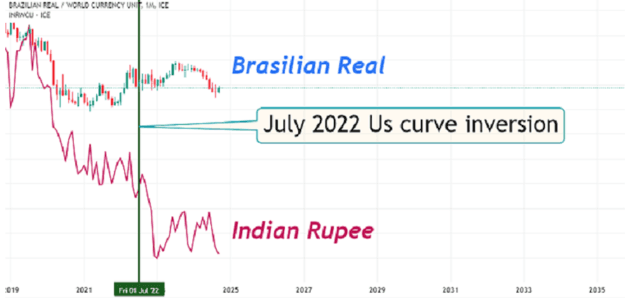
Indian Rupee-Brazilian Real.
The Indian Rupee continues its decline, which had already started before the inversion, while the Brazilian Real seems completely unaffected.
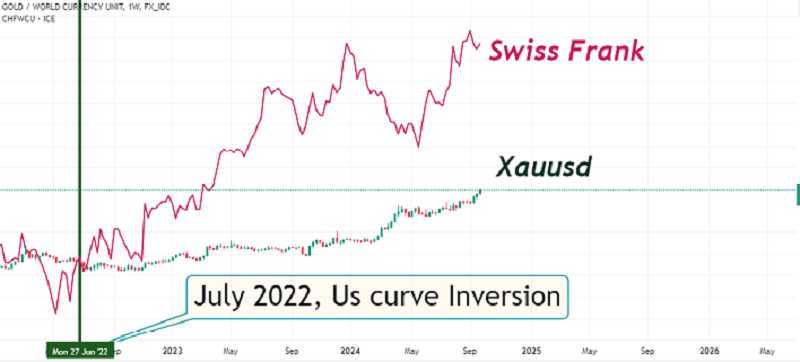
Swiss Franc and Gold.
Historically known as “safe havens,” both begin to rise the moment the yield curve inverts. As we’ve noted, since the charts are on different scales, we can’t analyze comparative levels or relative growth between them, for now.
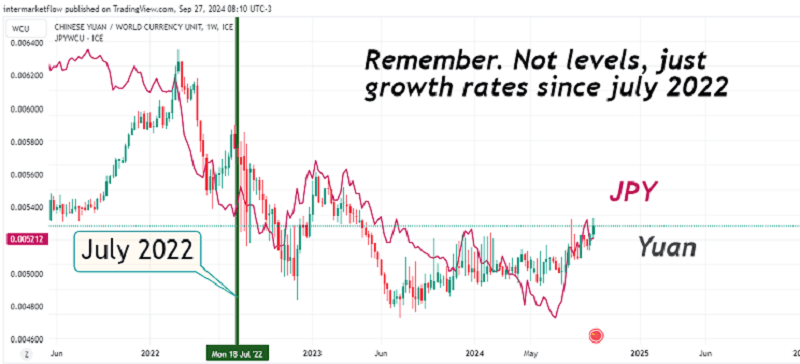
Yen-Yuan.
Both experience an initial drop followed by a recovery. The yen’s movement is partly due to the unwinding episode, while the Yuan is harder to analyze, as it’s heavily intervened by the Chinese Central Bank.
Relative Growth-Carry Trades: Euro, Swiss Franc, and Gold.
The Euro and Swiss Franc are the fiat currencies that have responded to the curve inversion. Both are considered diversifying currencies and have historically served as safe havens. Gold, a commodity closely associated with safe-haven status, has the unique characteristic of not generating income, which leads to a high opportunity cost.
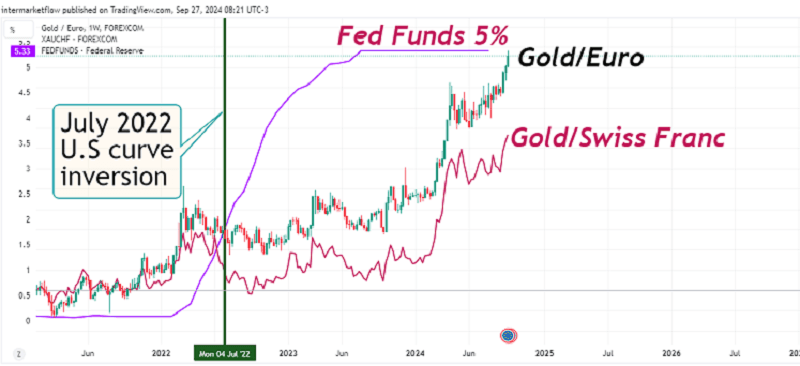
There is no carry trade between the fiats. We are witnessing a currency rotation toward “safe havens,” but this rotation is more pronounced towards gold, despite its nearly 5% opportunity cost since July ’23. This is a fully defensive market, as we mentioned here on July 15, 2024 that accepts the opportunity cost in exchange for greater security.

Setups: Trading a Short-Term Rate Drop Amid a Recession in the United States.
You can find the setup that generated this research here.
As always, I hope you enjoyed this as much as I did writing it. That’s all for now.
Trades and setups derived from this analysis can be found in Article #22 and are exclusive to subscribers.
Please share this.
The subscription won´t cost you anything and it makes our day. You can find us at intermarketflow.com and on X @intermarketflow.
See you soon,
Martin.
Intermarketflow.com
- Intermarketflow