Analyzing the big picture, it doesn’t seem to reflect a slowdown. However, the latest rally is not supported by volume and is very close to the area where the market sees value. Only when we move to relative comparisons will the sector’s decline against other options become evident.
Sector Valuations: Consumer discretionary, the start of the rotation.
Vs Staples
Sector Valuations: Relative trends
Relative comparisons give us a clearer picture of the current situation. The bullish trend in consumer discretionary is not as strong when compared to staples. This started in October 2023.
It not only means that the trend in discretionary is weak, but it also implies that the trend in staples is stronger. What matters here is the shift from a cyclical sector like discretionary to a more resilient one like staples. The market is quietly evolving.
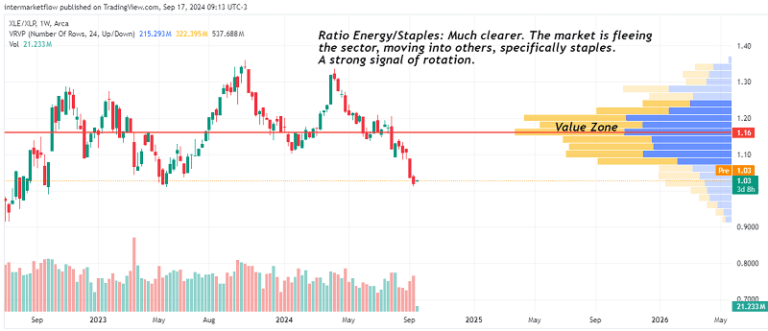
Sector Valuations: Energy
Vs Energy
The rotation is even more evident. The setup to short the energy sector became clear here on September 10.
Sector Valuations: Sensitivity
In our checklist, sectors 1 and 4 are already showing the effects of a slowdown. Very clearly. Sectors 2 and 3 have been highlighted in repeated reports, revealing imminent threats.
These sectors currently offer the largest deviation in sector valuations. As you know, we are already trading them.
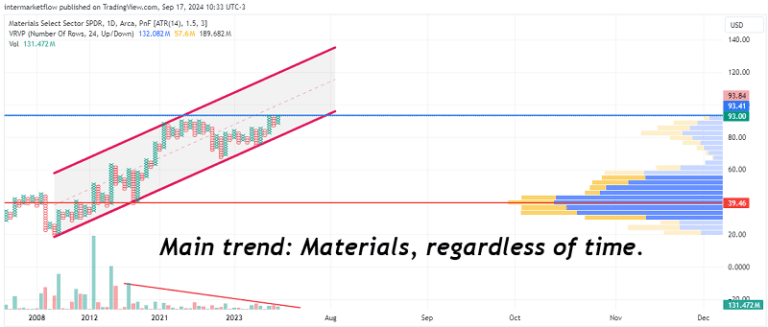
Sector Valuations: Materials(xlb). A new Set-Up.
The trend is bullish when time is removed from the analysis. There’s a noticeable loss of momentum, but no trend reversal yet.
Sector Valuations: Materials including time.
The upward trend, once we include time in the analysis, is no longer as clear. The loss of momentum becomes evident. The possibility of a double top is present, with confirmation coming from a daily or weekly close (depending on each trader’s horizon) below 90. That would confirm the double top and establish a target.
An asset in an uptrend, when you exclude time from the analysis, turns into an asset that is moving sideways. Being aware of these differences is a key part of analysis.
Sector Valuations: Momentum.
This asset needs a break. If it’s an accumulation zone, it will consolidate; if it’s a distribution zone, it will correct.
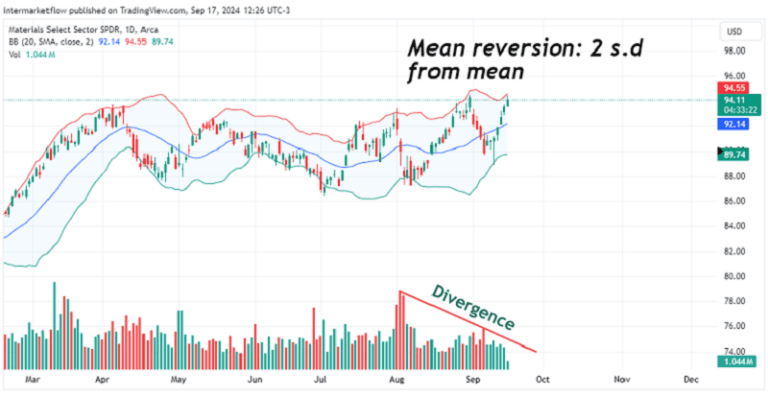
Sector Valuations: Mean Reversion.
Mean reversion of assets helps distinguish between accumulation and distribution zones.
It’s 2 standard deviations from the mean. It needs to either pause long enough for the mean to catch up from below or correct towards it. Given the upcoming reports, a correction seems more likely, as it’s logical to assume higher volatility. I’m writing this on Tuesday the 17th, with the Fed meeting tomorrow.
Furthermore, volume is thinning, which definitely makes a correction more likely.
Sector Valuations: Cycles and Time.
Sector Valuations: Approaching the setup.
As always, different trading styles emerge: those with lower effectiveness but higher P/L, and those with higher effectiveness but lower P/L. The style itself is indifferent. Like everything in life, the key is to be consistent and coherent with your style. Choose whichever style you want, but respect the P/L that comes with it.
A.Beer and Whisky-Very Riski
This is a low-probability trade. If you decide to trade it, your mindset must be prepared to respect both the Profit and the Loss. Without that, you have nothing.
B.Whisky and Beer-No fear
It might seem like we’re contrarians. NO. Not at all. We trade based on our macro view, which, in this particular asset today, happens to be contrarian.
We’ve already discussed our style in these situations. It’s up to you to choose yours. Needless to say, in markets, there is no such thing as a “no fear” scenario. It’s just the internal name we use for the style.
As always, these are our trades that we share for marketing purposes. They don’t have to be yours and are by no means recommendations. Do your own work!!
I hope you enjoyed this as much as I did writing it. Opinions and constructive criticism are valued and wellcome.