Intermarket Analysis Throught Macro and Technical Methods
#18 Trading the upcoming recession
Macro Cycle: Trading set-ups for two different economies
In this article, you will find:
A macro summary of where we stand now.
A technical trading set-up for a slowing economy.
A technical trading set-up for a recessionary economy.
Take your time.It’s worth it.
In a slowdown phase with the most likely recession perspective between October 24 and May 25.Trading has to consider both scenarios. They are quite similar but not identical.
Macro Views
1.A trading set-up for an economic slowdown instead of a recession
Heald Care Sector etf XLV
Main trend upward. In motion. It doesn’t make sense to jump in now. We need to wait for a correction so that the P/L justifies the risk.
A trading set-up big picture.
We can see how the latest upward movement is overextended, well above where the market sees “value.” This trade is primarily designed for a slowing economy. It will also work in a recession but with a more defensive risk-off role than it was designed to fulfill.
Momentum
It reflects the situation. Entries far outside the value zone to continue a trend are risky. Corrections can leave you out of the game.
Volume
The bearish divergence in volume suggests that the latest rise is not sustainable. No one is selling. But there are fewer and fewer buyers. A correction makes sense, because not all the buyers are the same type. Holders and day traders take profits at different times. This is where one of the pillars of technical analysis comes into play: Mean reversion.
Mean Reversion
It comes from being 2 standard deviations above the mean. Concurrently, the area of interest for us is precisely the mean.
Buy the dip. Alerts on $150 for us.
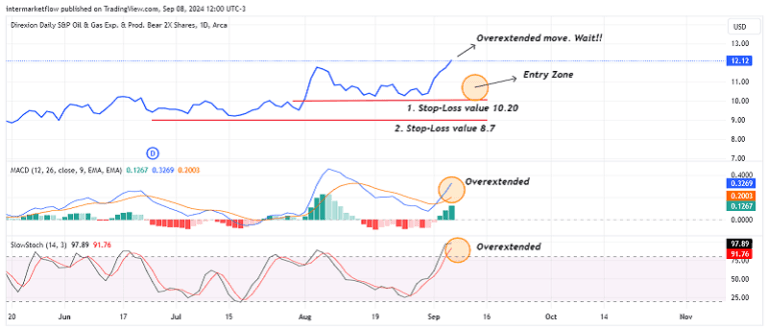
2. A trading set-up for a recession. Our main view.
Our technical process is to look for trades aligned with our macro view. However, when we analyze a trade, the first thing we look for is the stop-loss. After that, we consider the target.
Today, it is full of trades for recessions. The challenge is to find the clearest setup according to those parameters.
The market is very clear from a technical perspective. The trends are clear, as well as the area where the market sees value.
Trading set-up big picture.
The clarity of the chart highlights the critical points: entry zones and probable stop-loss levels.
Excluding Time
When you remove the “time” factor, price activity is more clearly observed. Point & Figure allows you to see this. Volume in upward movements speaks for itself.
Momentum
The overextension and stop zones are clear. We could trade an upward breakout, but doing so in such a marked overextension exposes you to a correction and reduces your position size. The correct stop is extended, so you need to adjust the size of your trade accordingly.
Mean reversion
This chart clearly illustrates what we have been analyzing. The price is more than two standard deviations from its mean. Profit-taking generally brings you back to the mean, which coincidentally aligns with our “ideal” entry zone.
As always, these are not trading recommendations. These are our traiding set-ups trades, which we make public for marketing purposes. Conduct your own research and analysis.
I hope you enjoyed this as much as I did writing it. Opinions and constructive criticism are valued. That’s all for now. Please share this. Thesubscription won´t cost you anything and it makes our day. You can find us atintermarketflow.com and on X@intermarketflow.