New Home Sales US Economy: Key Trends in 2024
Future Predictions for New Home Prices
A breakdown of the new housing market, new home sales, within the American economy.
- By demand
- By supply
- By inventory
In these three segments, we want to examine growth rates, trends (flows), and stocks, as well as levels. We aim to understand whether this market is in equilibrium or not.
Demand: Existing Home Sales
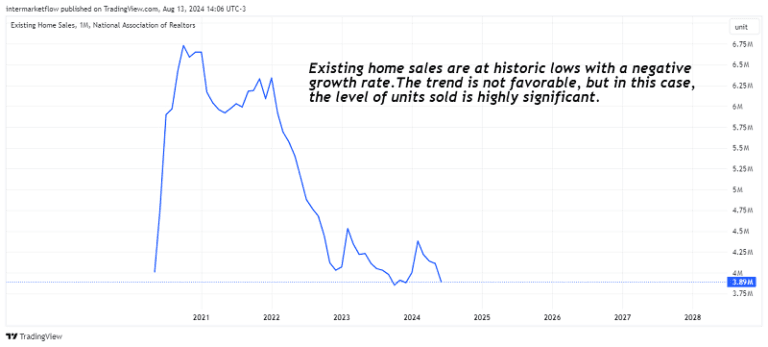
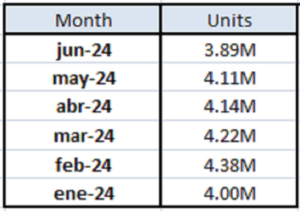
These are the existing homes on the market. Sales are declining, at this time no one wants to switch mortgages to buy a new house. Coupled with the fact that prices have risen significantly in price on average.
Numbers
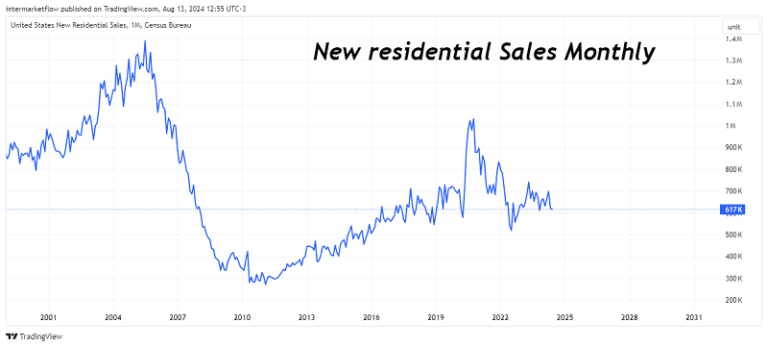
New Home Sales
A completely independent market. A metaphor could be the comparison between used car sales and new car sales.
New Home Sales numbers.
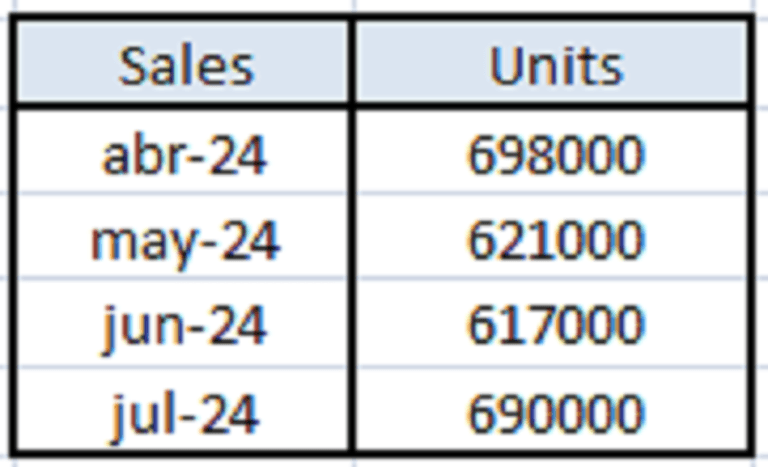
*Seasonally adjusted data.
Market Inflow: Building Permits
The time between a permit and a completed residence ranges from 6 to 12 months, depending on various factors. That’s how long a construction project takes. To understand this flow, we need to analyze the past year, which gives us a clear idea of what will be entering the market.
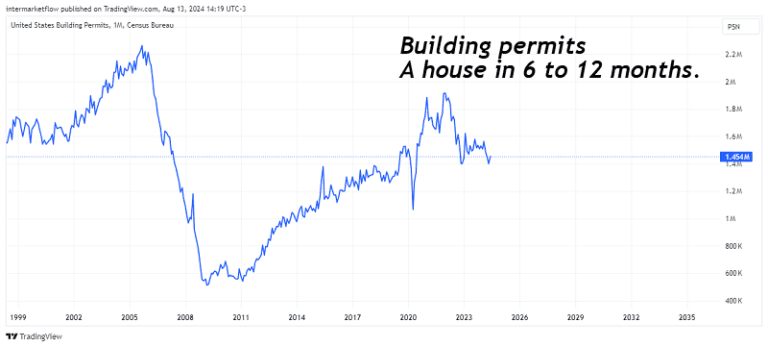
New Home Building Permits
June 2024, the building permits from June 2023 are entering the market.We are aligning timelines and quantities correctly.
All things considered, let’s take a look at the last 4 months.

Back to the Future: New Home Prices
We have data on building permits up to today. Essentially, we have a very real estimate of what will enter the market over the next 12 months. To stick as closely to reality as possible, let’s look ahead just 4 months. This means assuming that the building permits from September, October, November, and December 2023 are completed. These projects are too far along, some nearly finished, to be abandoned halfway.
Next 4 months for New Home Sales?

The relevant question: What sales can we expect between September and December 2024? What are X, Y, Z, and D?
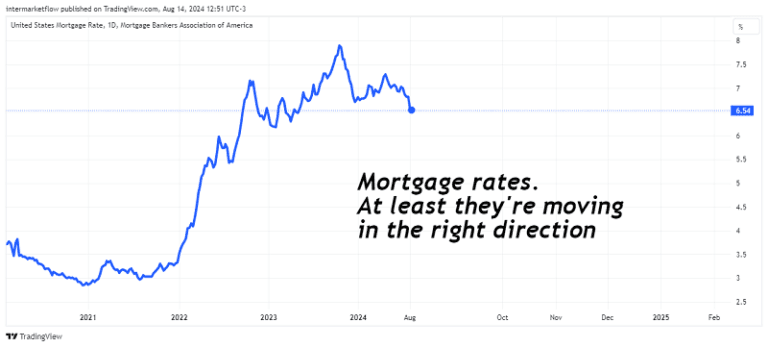
State of Demand: Mortgage Rates and New Home prices
Real disposable income has been declining for this and other reasons. We discussed this here. We are in an inflationary scenario that, even today, has not managed to bring inflation back to the 2% target. The continuation of this situation over time (as we discussed here) results in a constant decrease in real disposable income.
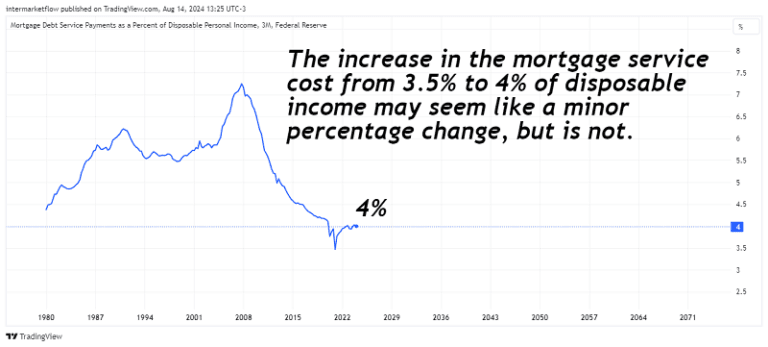
It’s half a percentage point of real disposable income. Considering the accumulated inflation post-COVID, disposable income has been significantly impacted. In fact, it is that it’s still being impacted today.
New Home Prices
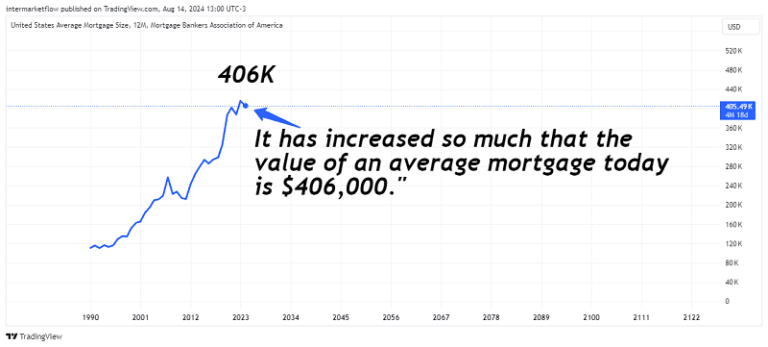
This is a consequence of an extended period of mortgage rates at 2%, 3%, and 4%. This is the reason why the price of new homes is at historic highs.
New Home Prices and lenders
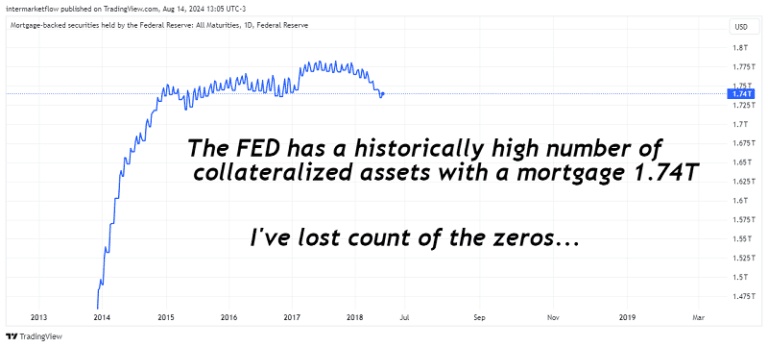
Even the F.E.D. is exposed to this phenomenon. The regional bank crisis, although primarily focused on the commercial property market, created this situation. The problem arises when the value of those assets is lower than the value of the mortgage. New residences will likely start changing hands, potentially first creating a problem for builders, then for banks, and, as always, eventually for the lender of last resort:
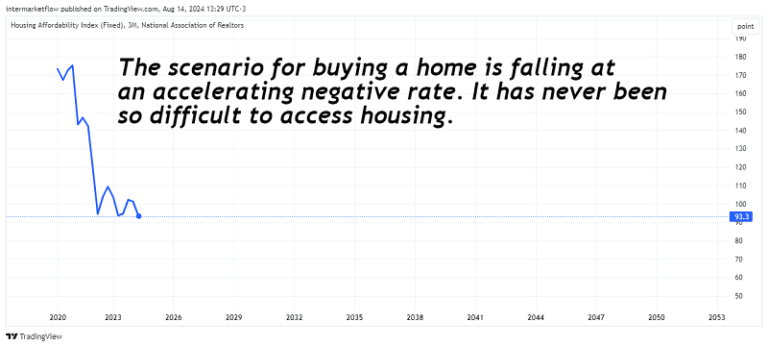
Property prices are through the roof, real disposable income is falling, and high mortgage rates are creating this situation. It has never been so difficult to access housing. Never! It is not expected that the return to equilibrium will come from the demand side. Not under any circumstances. On the contrary, if anything, we can expect demand to continue declining.
Supply and Equilibria: Prices or Quantities for New home sales
This market, by its nature, tends to adjust quantities in a very sticky manner. Projects that are halfway done, permits already granted, among other reasons, cause the supply to be slow in reacting. We have a year’s worth of building permits in the pipeline, far exceeding sales. Even if we assume that the last 6 months of permits were canceled, we would still have the same problem.
Essentially, there are 4 distinct problems:
- Trends of the variables: Demand is falling, supply is steady with prices at record highs, and purchase conditions are terrible.
- Growth rates of the variables: Sales are droping fast.Inventory is growing at a stable rate
- The stock level of the market: A market slow to adjust by quantities.
- The price level: Historical highs inflated by years of very low-cost mortgages.
New Home Prices
I repeat: In August 2024, we will have 2 new units entering the market, but only 1 will be sold.
Initially, builders will be reluctant to stop due to the inconvenience of leaving a project unfinished. The loss would be 100%. By completing them, the losses may be smaller. In the new construction market, we have a problem of oversupply in construction trends, declining sales, and conflicting growth/decrease rates of both variables. The most risky factor is the stock size.
This is already happening and worsening month by month. Obviously, the initial adjustment in this market will come through prices.
Let’s delve deeper: The Builder—Current State and Expectations for New Home sales
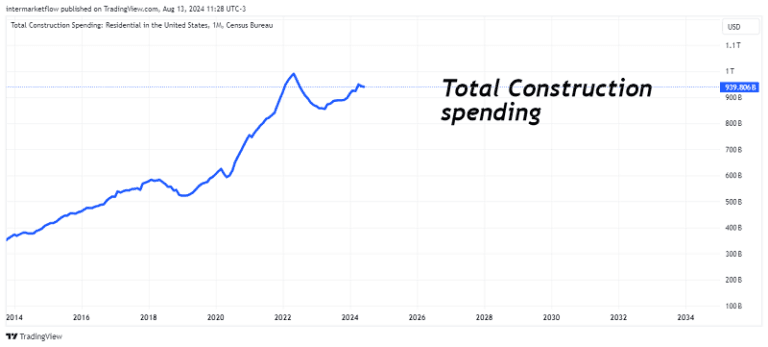
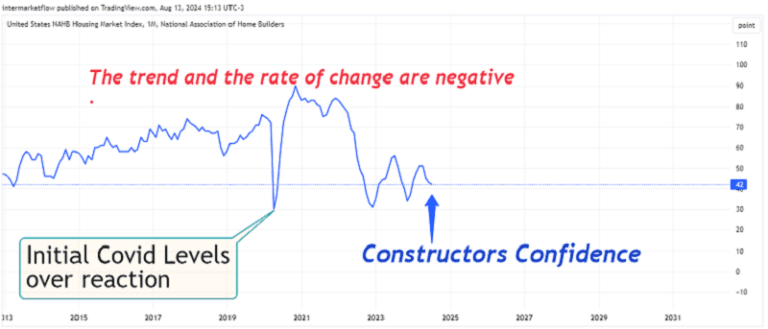
Construction spending is very close to historical highs, even so, builders’ expectations being at levels similar to those seen during the COVID period.
More: Case Shiller New Home Prices
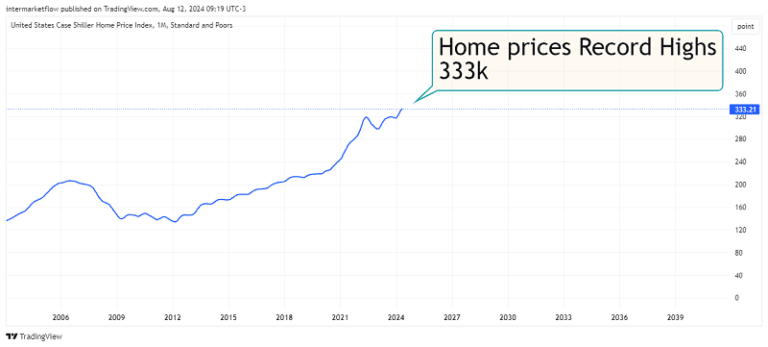
F.E.D New home prices
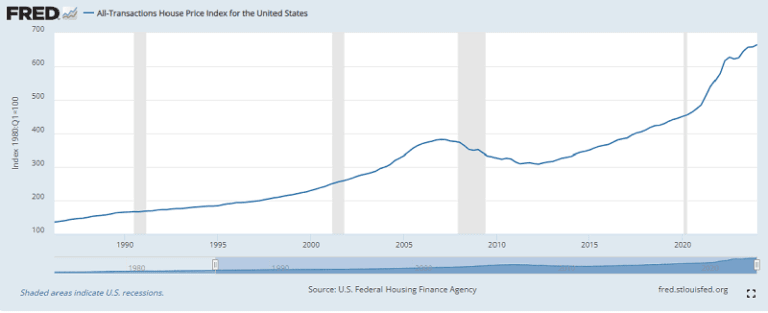
The Federal Reserve reflects prices with an index based on 1990. This is an absolute historical record. As we’ve seen, cheap mortgages over many years inflated prices by increasing demand.
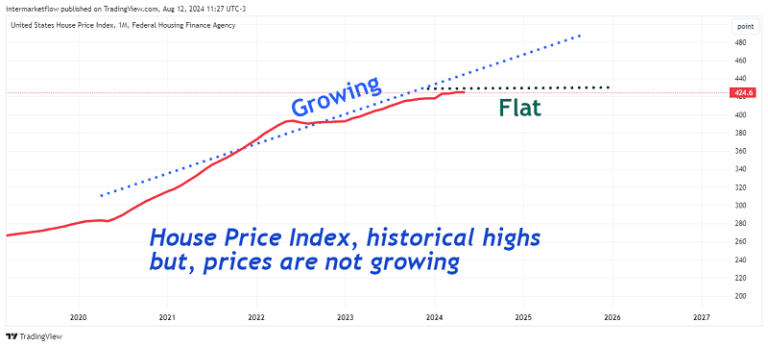
What is happening in the market today? Coming next? The return to equilibrium in this market?
Prices are beginning to reflect this context. They have stopped growing, and in leading indicators, they are already declining.
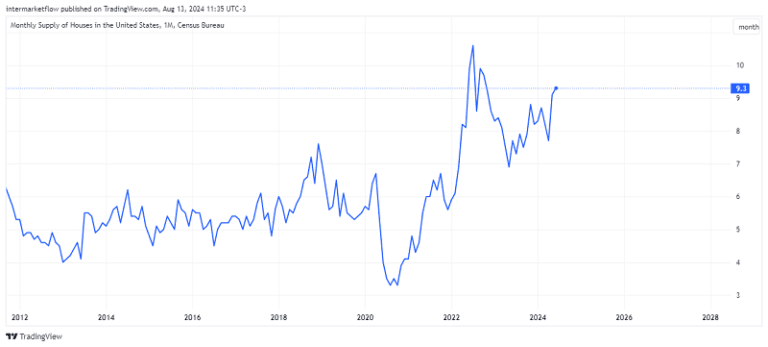
The Monthly Supply of Houses in the United States is a measure that reflects the number of months it would take to sell all the homes currently on the market if no more houses were listed, assuming the current sales pace remains constant. This indicator is crucial for assessing the balance between supply and demand in the real estate market. More than 6 months indicates a buyer’s market. Bargaining works. We are currently at 9 months. We’ve seen worse, but the growth rate is rising and high.
Conclusions
- The market is completely out of balance.
- Quantity adjustments are naturally slow.
- Prices are at historic highs.
- Home buying conditions have never been worse.
It’s clear what’s coming: prices will adjust. The questions are how quickly and how deeply. This is what we’re going to trade on.
Cascading Effects
- Speed of adjustment: Determines the impact on builders.
- Depth of adjustment: Affects mortgage holders.
- Consumer impact:Recent homebuyers will see their assets lose value, which will also affect consumption.
Trading Strategy
Shorting those involved in the production chain:
- Builders: How fast will the adjustment happen?
- Mortgage holders: How deep will the price drop be?
- Consumers: We’ve already shorted companies exposed to discretionary spending as discussed earlier.
Investment Vehicles
- ETFs
- Individual stocks:
I’ll take a few more days to refine the setups for these vehicles. I want to alert you to this situation as I see it. I will strive to provide the quality analysis you deserve.
As always, I hope you enjoyed this as much as I did writing it. I’ve been passionate about my work for nearly 30 years now—a privilege life has granted me.
That’s all for now. Please share this. The subscription won´t cost you anything and it makes our day. You can find us at intermarketflow.com and on X @intermarketflow.
See you soon,
Martin
Intermarketflow.com
- Intermarketflow
