Macro View for trading American economy
Macro View based on Fundamental Analysis for the American economy
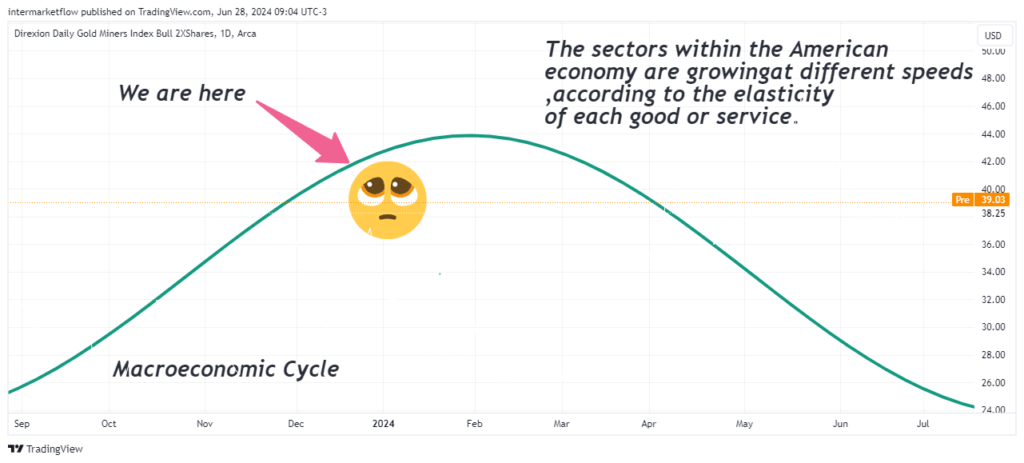
The macro cycle

Macro View, Fundamental Analysis American economy
Argument 1: The Perceived Safety of Logn-Term Bonds
The trading volume is in the long end of the yield curve, in the segment ranging from 20 to 30 years. Capital is securing long-term returns, likely from pension funds or similar entities seeking to generate consistent returns over time. These are portfolio managers adding duration in their rebalancing. They consider this a risk-free return in an investment intended as an anchor for profitability rather than generating immediate profits. This is the motivation for large pension funds and insurers who need liquidity and moderate returns. It’s wrong to think of these investments as risk-free, as they carry dollar risk, but they undoubtedly offer what these entities seek in terms of profitability and liquidity.
Understanding Volume Distribution in Bond Markets
This positioning is clearly defensive, or “risk off.” The same behavior can be observed in other “safe havens,” like gold, for example. We see it here. Look at the different volumes among the segments of the yield curve:
Short end: 0 to 10 years. The capital is parked here right now

Middle of the curve: 10 to 20 years

Long end of the curve: 20 to 30 years

Argument 2: Effects of Inflation on Short-Term Rates
Inflation expectations are currently declining, according to FED data. This variable is another leading indicator of short-term rates, or FED rates. As of now, they suggest an imminent decline in short-term rates, giving us an idea of the timing of the situation.

Argument 3: Comparative Analysis with Previous Rate Cycles
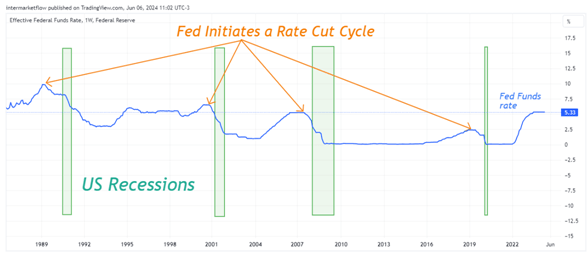
We know that after the start of rate cuts, a countdown to the next recession begins. History tells us this. Today, the market assigns a 56% probability of a rate cut for the September 18 meeting. If so, the countdown would begin. For more in-depth analysis on this topic, you can check out our previous article here.

Numbers

Yield Curve Inversion and Recessions
History also tells us the time lags between the inversion of the yield curve and the next recession.

Forecasting Future Economic Trends
They are two tools with different uses. Both are based on market expectations, including all economic agents. This gives them strength as leading indicators. There are no statistics involved, no data collection, no publications with outdated information. It is the market speaking from its core about what is coming with the public information available today.
The first starts the countdown to the next recession, while the second tells you that the recession will occur.
Overlaying both tools, we can create a "Gant chart" to forecast the recession.

Argument 4: Interest Rate Movements
The spread between the 30-year yield and the FED rate is another excellent leading indicator of upcoming recessions. We saw this here.
The recession follows the maximum negative difference between these two rates, like the moon follows the sun.

Currently, that spread looks like this:

Argument 5: FED Rate Levels
The current FED rate is at the same levels as during the Dot.com and GFC recessions.

Argument 6: Spreads 10-2 of the Yield Curve
The 10-2 spread of the yield curve, the most popular in the market, is at unprecedented and unsustainable levels of correlation with the FED. We saw this here.
A new macro narrative is coming.

Stepping away from strictly macro analysis, we can see that technically, the 10-2 spread looks like this:

Argument 7: Consumer Spending Patterns
Real Income vs. Real Disposable Income
Here we see the difference between them: We delve deeper into this in the previous article

We can observe the different growth rates of both incomes:

Real income grows at constant rates, while real disposable income grows at negative rates. This divergence is a warning sign for consumer spending.
Argument 8: Job Creation and Its Effect on Consumption
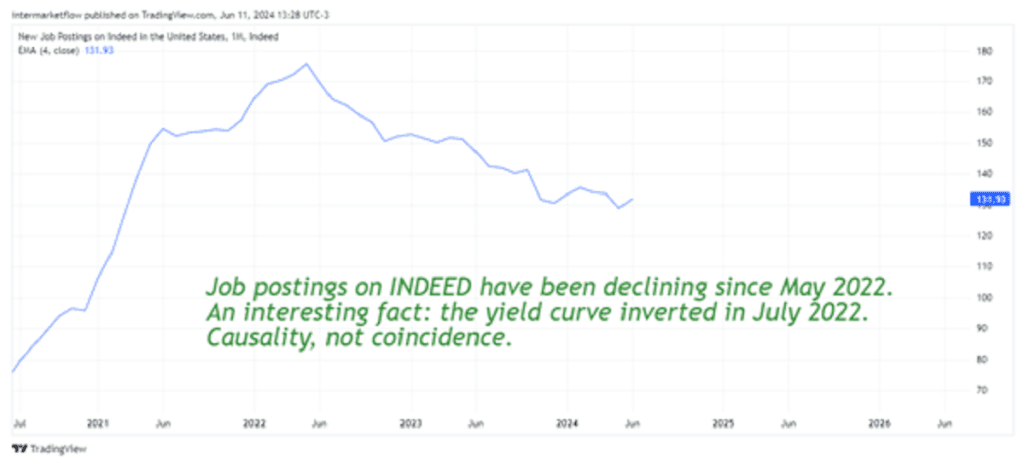
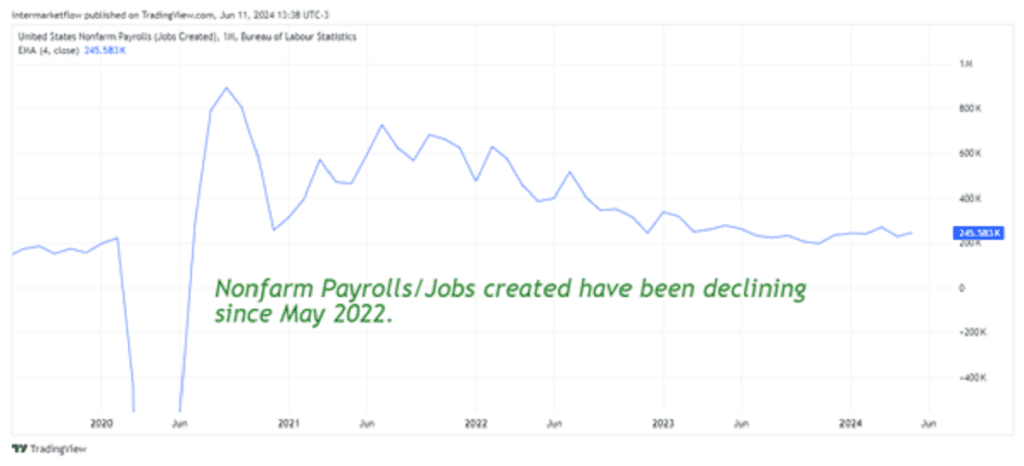
This is a guarantee of a slowdown in consumption, starting with non-durable goods, especially discretionary items.


Argument 9: Sustainability of Consumption
Aggregate real consumption continues to grow at constant rates. How can this be?

Furthermore, the consumption of non-durable goods has stopped growing

There are two main reasons for this:
1.The Role of Consumer Debt
Consumers are taking on debt through credit cards and consumer loans, which are the most expensive types of credit.We delve deeper into this in the previous article.
Credit Cards Loans

Of course, delinquency rates are skyrocketing.

2. Government Fiscal Policies
This variable exceeds macro analysis but not common sense. It’s an election year, so we expect it to rise. It can definitely delay the economic cycle over time, but it cannot change it. Sooner or later, macro variables will prevail.

Argument 10: Savings
Savings are at the same levels as during the Dot.com and GFC recessions. The level is concerning, but even more worrying is the growth rate, which is increasingly negative.

Argument 11: Impact of FED Actions
The FED’s work is showing results. Private credit creation is slowing down. This will inevitably slow down private consumption. Remember, private consumption represents 70% of the American economy.

Argument 13: FED Rate Levels
The current FED rate is at the same levels as during the Dot.com and GFC recessions.

Conclusions

Additional conclusions and, most importantly, actions and setups based on these conclusions will be sent via newsletter on Friday. Specifically, there are two trades that we are executing this week.
For those consulting firms and research firms already registered, we have collaboration models working in various countries. Don’t hesitate to contact us, and welcome. I hope you take off your suits and enjoy this journey as much as the rest of us.
Subscribe. It won’t cost you anything, and it will make our day! Either way, thank you for reading, and we’ll stay in touch.
Best,
Martin
Intermarketflow.com
- Intermarketflow
Intermarket Analysis LLC
703 Waterford Way - Suite 805 - Miami, Fl 33126
Unlock Full Access
We create professional content for traders, based on intermarket, macro, technical, quant, and flow analysis.
Welcome aboard — enjoy the ride.
If you have already registered before, please enter your email again to recover your session.

I am extremely inspired along with your writing abilities as smartly as with the format in your blog. Is that this a paid topic or did you modify it your self? Anyway keep up the excellent high quality writing, it is rare to see a great weblog like this one these days!
Thank you! Enjoy it while you can—soon we’re switching to paid mode.
Happy to join conversations, share thoughts, and pick up new insights along the way.
I’m interested in learning from different perspectives and contributing whenever I can. Always open to new ideas and connecting with others.
There’s my website:AutoMisto24
https://automisto24.com.ua/