Liquidity and the Plumbing of the Monetary System(1 of 2)
Liquidity and the plumbing of the monetary system are broad concepts, often misunderstood. To make matters worse, each part of the system comes with long, formal, and painfully boring names.To explain it as simply as possible —and since we’re talking about plumbing— let’s visualize it exactly that way.
Liquidity and the Plumbing of the Monetary System
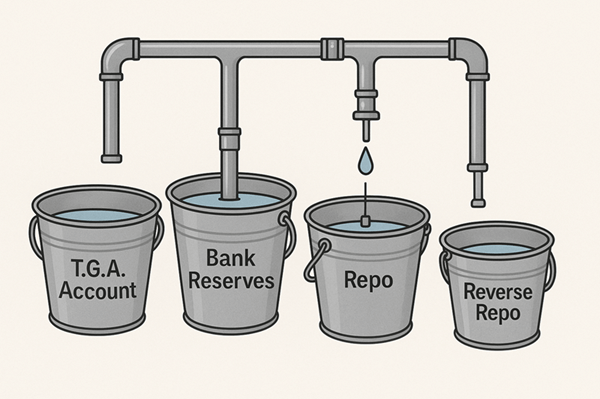
This is the monetary plumbing system: four buckets whose levels rise and fall as money flows between them or out to the real economy — each with its own valves and players inside.
Liquidity and TGA Account
This is the Treasury’s checking account at the Fed — the government’s main cash account. Money flows in through taxes and bond sales, and out through salaries, defense, and public spending.
It’s the only bucket beyond the Fed’s control, fully driven by fiscal policy.
A large, persistent deficit keeps injecting fresh money into the real economy — inherently inflationary, and a key reason why assets like stocks, housing, gold, and crypto remain at record highs.
Liquidity and Bank Reserves
The second bucket — bank reserves — is essentially electronic money, entries on the Fed’s balance sheet. The Fed creates or removes them with a keystroke, crediting or debiting large banks’ accounts.
It adds or drains reserves — usually through Treasury bonds — to manage liquidity.
That’s QE when it injects, and QT when it pulls liquidity out.
Liquidity: A historical perspective on Reserves evolution

Current Trend

The small decline we’ve seen lately is QT doing its job — the same QT that Powell already hinted could end soon.
Liquidity: Banks and Their Reserves
When banks receive reserves, they gain more money to lend, invest, or hold — a decision each makes individually.
But not all liquidity the Fed injects reaches the real economy; most stays circulating within the banking system unless banks choose to deploy it.
The Fed pays interest on these reserves — the IORB (Interest on Reserve Balances) — set just above the Fed funds target.
It’s not a market rate, but one that moves in perfect sync with Fed policy.
Liquidity and the R.E.P.O market
This market developed naturally, not by design. It’s where banks lend and borrow using Treasuries and cash at a market rate.
The SOFR or Interbanking rate created in this market, (which replaced LIBOR), is the key liquidity thermometer. The Fed doesn’t set it, but controls it indirectly through the Standing Repo Facility (SRF), a tool to ease sudden liquidity shocks like the 2023 regional bank crisis.
Liquidity: REPO volume

Repo volume isn’t fixed, and a drop doesn’t mean a cash shortage — it usually means banks have enough liquidity or prefer to park funds at the Fed through the reverse repo facility.
In short:
- High volume → demand for liquidity.
- Low volume → excess liquidity or less need for interbank funding.
It’s key to understand this. When you hear that “repo funds are running out,” it’s simply not true. If trading slows, it just means banks aren’t lending to each other.
When that inactivity turns into stress, the SOFR rate is the first place it shows up — exactly what happened yesterday, when banks wanted to transact but scarcity pushed rates higher.
This rate is the backbone of the entire economy, and it’s something the Fed can’t afford to ignore.

Reverse Repo
Created after the GFC, this market grew massively during the QE years, when excess liquidity pushed short-term rates lower. To contain it, the Fed created this “bucket” — a place for excess cash to park.
Fannie, Freddie, and money-market funds deposit cash here and receive Treasuries in return — another valve in the system’s plumbing.
The Overnight Reverse Repo Rate, set by the Fed, is the floor for all short-term rates — no one lends below what the Fed pays here.
The evolution of Reverse Repo volume

Reverse Repo Rate
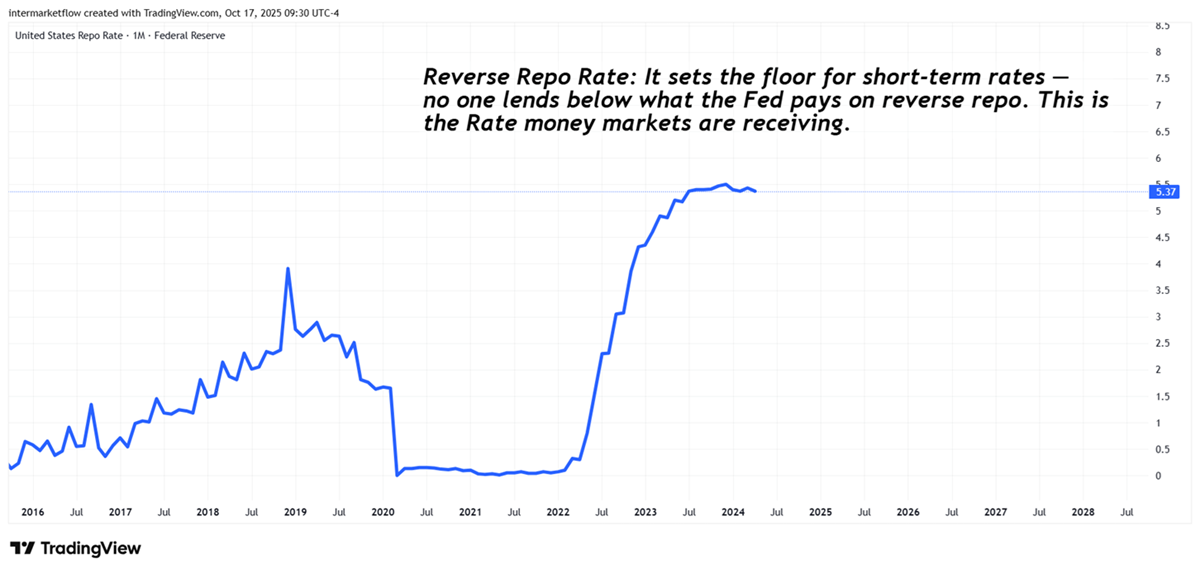
This is the rate Money Markets receive. Are they happy with it?
Where’s the liquidity — in the real economy or parked in money markets?
Current Money Market volume

All this is denominated in dollars, earning the reverse repo rate — and fully liquid. Basically is where a monster Liquidity is parked today.
These are the four buckets. As you can see, the monetary plumbing system isn’t that hard to explain. What’s truly complex is understanding why the flows move between buckets — and filtering out the endless nonsense people say about it.
Liquidity and the real economy
Reading Liquidity only makes sense in a macro context. Right now, the financial system is overflowing with cash, but the real economy has lost momentum.
That liquidity hasn’t disappeared — it’s parked in money markets, bank reserves, and the TGA, sitting outside the productive circuit. It shows an economy that’s cooling off, where players prefer to hold cash instead of taking risk.
The Fed’s been draining the excess through QT, yet Powell hinted it might end soon, worried about the labor market.
Basically, it makes no sense — the Fed wants to stop draining liquidity to stimulate the economy, while the system is already overflowing with cash.
The problem isn’t the amount of liquidity; it’s that none of it is reaching the real economy because the economy is not generating the opportunities where the liquidity could go.
As for yesterday’s spike in SOFR, it wasn’t about a shortage — it was about where the liquidity is sitting. The money’s there, just spread across the wrong buckets — the TGA, money markets, and bank reserves.
When liquidity pools in the wrong places, the pipes clog — and the rate jumps.
What liquidity can do
- Support asset prices – it keeps stocks, bonds, real estate, and 30 year rates via buy backs for example. Even crypto when there’s too much of it.
- Push short-term rates lower – more cash chasing yield drives rates down.
- Ease financial stress – acts as a buffer against defaults or funding squeezes. This isn’t a minor point. Allows to kick the rock down the road.
- Delay valuation resets – can hold prices artificially high for longer.
- Keep the interbank system running – ensures the plumbing keeps flowing smoothly.
What liquidity can’t do
- It doesn’t create real growth – unless it reaches investment or consumption, it adds no economic activity.
- It doesn’t fix weak balance sheets – it can hide problems, but it doesn’t improve solvency or returns.
- It doesn’t change confidence – if risk appetite is low, money won’t flow no matter how much there is.
- It doesn’t guarantee credit – if banks don’t want to lend, liquidity just sits still.
- It doesn’t fix a business model that isn’t profitable — it’ll keep losing money, with or without liquidity.
Liquidity and the Capital markets
What happened in the market this week?Where did the flows go?What’s the market’s sentiment?And what happened in the intermarket?
Next Week’s Trades
The following tables show not just the direction, but more importantly the intensity of weekly flows. They hold valuable information on their own, as they reveal where return and volume converged — and where they didn’t.
Liquidity Flows: Convergence

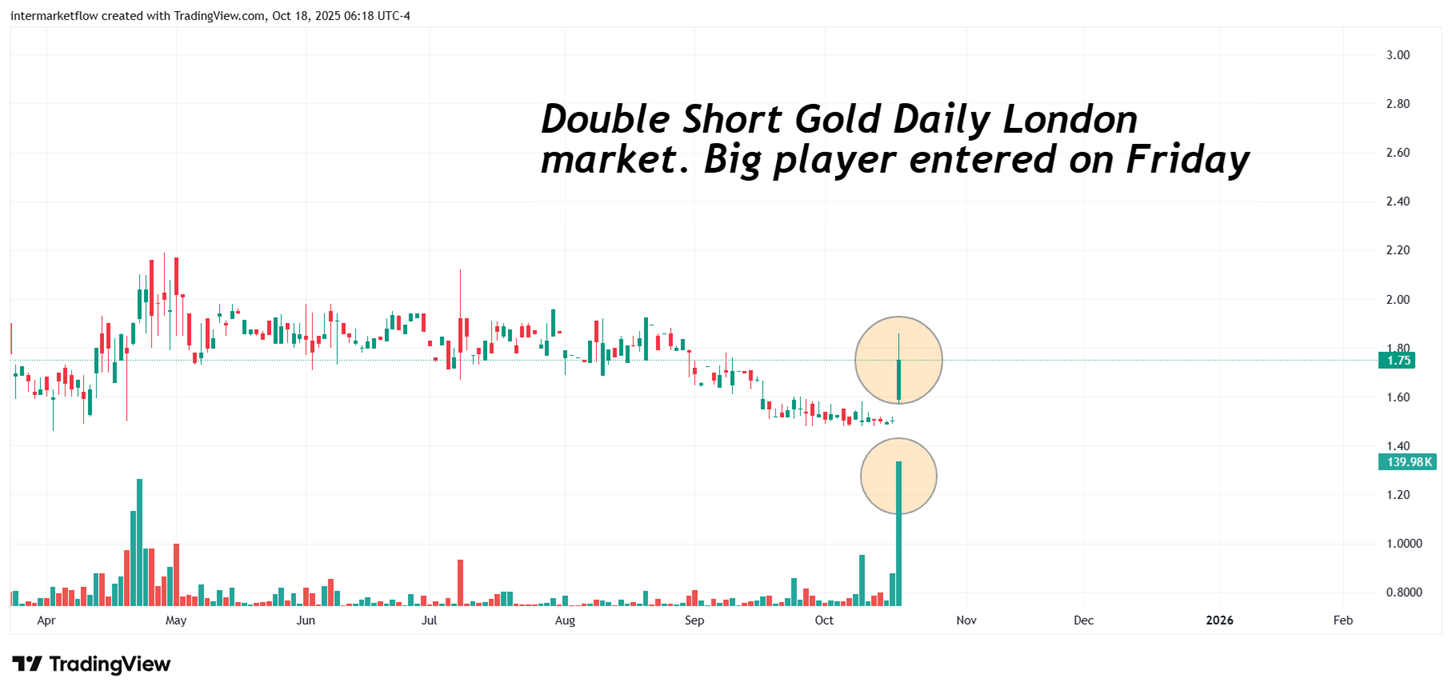
It was logical to see such extreme convergence in gold — an asset trending at that level can only exist in that state.
It’s also interesting that on Friday, during the European session, a major player took an opposing position against gold, which turned the ETF’s weekly return positive.
Across the entire ETF spectrum, these were the three assets that showed the highest congruence between return and volume, relative to their own behavior. Remember the Z-score!
Divergence

In the case of these assets, all of them posted negative returns despite showing extreme volume increases relative to their own history.
Look at the list — it’s clear where the market moved this week.
Some of these setups are mean-reversion trades, while others are purely countertrend.
There are two in particular we’re analyzing for next week.
Next Week’s Trades

When we look for setups, we do it within the context of our intermarket and macroeconomic hypothesis. This is one of the assets we’re watching closely — it reflects our broader view.
For the technical analyst, the disproportionate surge in volume relative to the price compression is a clear sign of accumulation.
If that weren’t the case, such volume would have pushed the price sharply lower, in line with the still-prevailing trend.
Another vehicle that expresses our hypothesis
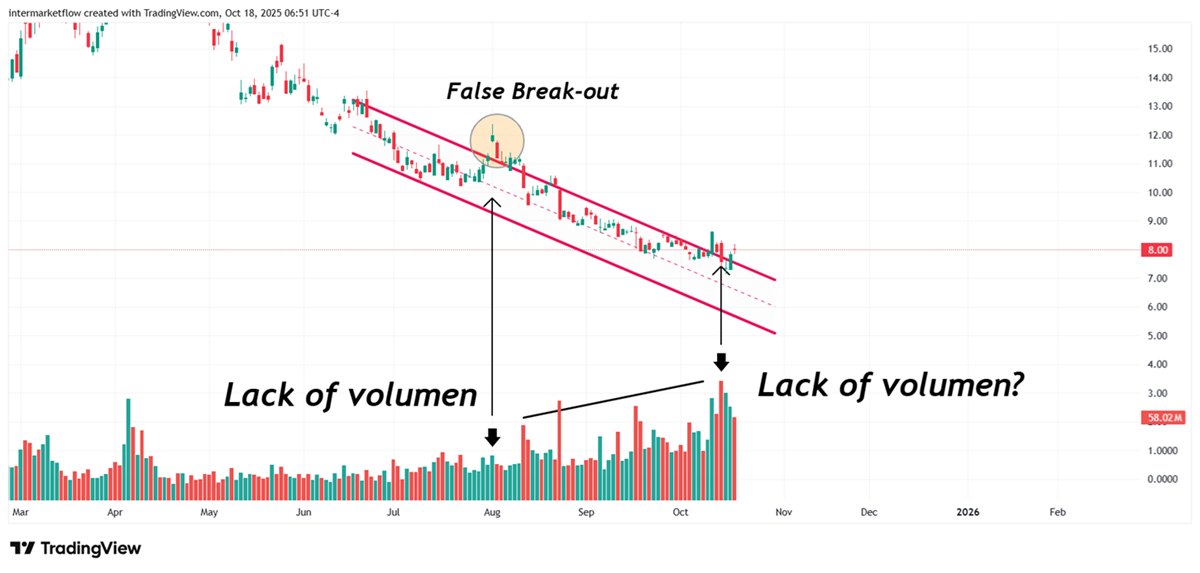
The technical pattern is identical — another setup under close watch.
Have a great weekend. See you next one, God willing.
Martin
If you believe this is an error, please contact the administrator.
2 Responses