#29- B Trading the 10 year real rate.
Here you will find: The complete technical analysis that frames a setup. The setup that derives from a micro, macro, and intermarket analysis we discussed here.
#29 10-Year Real Rate Trading: A Complete Guide

In this article, we break down the components of the 10-year real rate. We understand what has been driving its movements since September up to now. We study the evolution of the term premium and the intermarket repercussions it generates.
#28-C Point and Figure Basics: Charting Objectives Explained
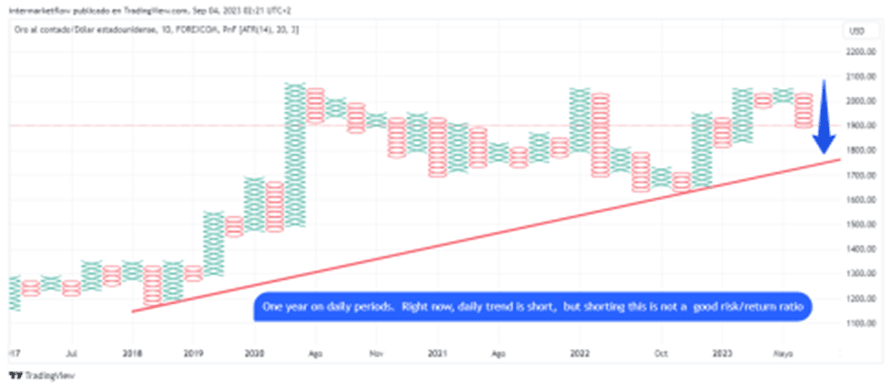
In this article, you’ll find a detailed description of the Point and Figure charting method. Its primary function (trend identification across different time frames), the method for plotting it, its pros and cons, and an example to clarify its use. I hope you enjoy it and find it useful, as it’s a fundamental tool in technical analysi
#28-B Trading a global economic slowdown through eurozone weakness

Technical setup, considering the three main dimensions: Trend, Momentum, and Mean Reversion. All framed within the passage of time.
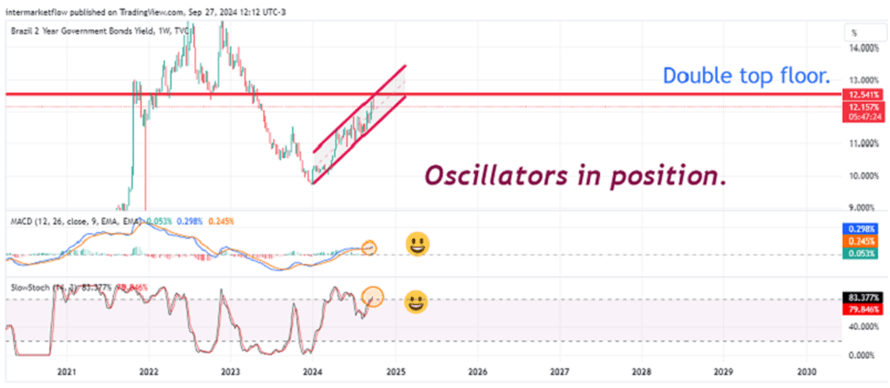
#27 Two Year Real Rate Trends and Analysis

We broke down the 2-year real rates to understand their evolution. We used the nominal rates, inflation expectations, and the 2-year term premium. The conclusions are clear.
#26 Action: Set ups, Real Rates and Equity Markets.

A complete technical setup derived from macroeconomic and intermarket analysis.
In articles #24 and #2.
#25 Trading Real Rates.
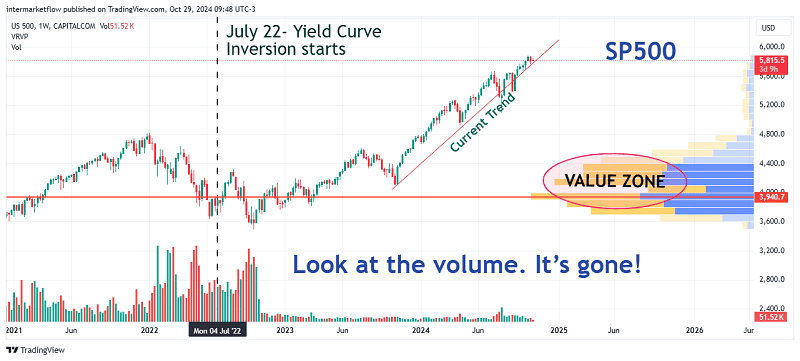
This is an article calculating current real interest rates for developed economies, primarily in Europe. It analyzes the strength of their currencies and major stock indices. A common pattern emerges across all of them: currencies are weak, and there’s a total lack of volume in the latest rally in their indices, making a correction imminent.
#24 Exploring the world of Currencies

In this article, we are attempting to infer the state of currencies and the global economy by conducting a sectoral analysis of supply and demand across commodity sectors.
#23 Commodities Currencies, Evaluating Risks and Rewards

We analyzed various commodity currencies, looking for potential destinations for liquid capital currently held in money markets denominated in dollars.
#22 Setups: Trading a Short-Term Rate Drop Amid a Recession in the United States
In this article, a technical setup is designed based on the macro and intermarket analysis from the previous article.