#28 Trading a global economic slowdown through eurozone weakness.
Real Rates, Nature, Its Lessons and the Choice of Prey.
Here, you will find the technical setup derived from the previous article, in conjunction with our macro and global view.
“It always amazes me to see a pride of lions hunting deer, zebras, buffaloes, giraffes, and even elephants. This perfect killing machine is constantly seeking the vehicle that will allow it to eat”
Despite their superior strength, they systematically seek weakness in their prey. From the largest to the smallest, the pride instinctively selects the weakest prey, whether due to illness, age, or size. Nature is wise and markets instinctively act in the same way.
Technical Set-Up:
Trading Vehicle: Amundi EURO STOXX 50 Daily (-1x) Inverse UCITS ETF Acc (Ticker: FR0010424135)
Prospectus
Trend

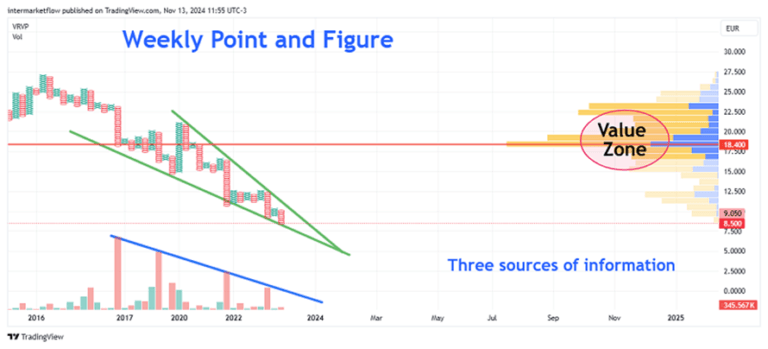
- The wedge formation describes both the current and future situation, showing where price compression occurs and between which levels.
- Despite all this information, the key info of a wedge is timing. It defines this critical element, with a clear culmination point.
Point and Figure.
This entire analysis, using a point and figure (P&F) excludes Time from the equation. Point and figure (P&F) is one of the most reliable charting methods, known for requiring significant moves to trigger signals. Although slower, it accurately captures price action by plotting only substantial closes and demanding larger reversals for confirmation, making it ideal for swing trading over 6 months or longer. Those interested in learning more about P&F can message us privately on X.
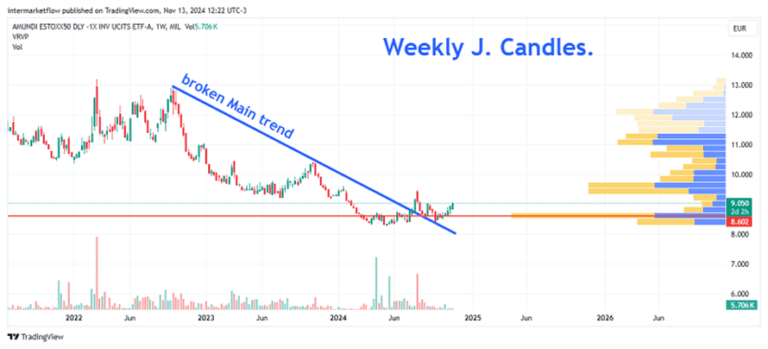
Japanese candlesticks, same time frame.
Japanese candlesticks display all closes, opens, highs, and lows—a real-time price chart that’s faster yet less reliable. Here, the volume profile changes, as many more closes are plotted. To see volume this charting method is more realistic. There is a marked support zone at this price due to high trading volume.
Notice that, in Point and Figure (P&F), the trend is still intact, while here, it’s been broken for some time.

Volume.
It illustrates the same situation as P&F, though I prefer this method here. The pattern repeats: the downtrend breaks due to this weakness. However, we don’t yet have confirmation of incoming volume in the opposite direction.
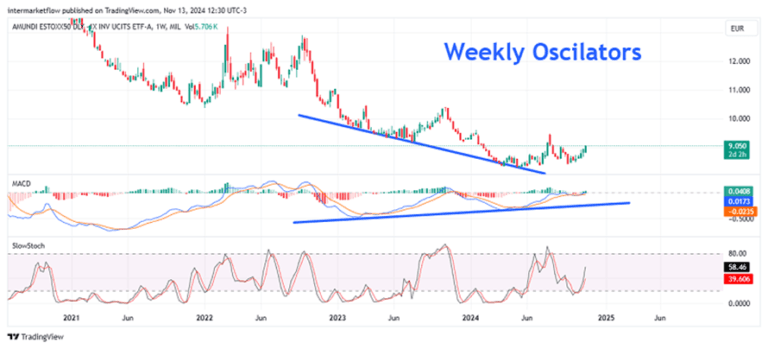
Momentum: Two Different Time Frames, Two Different Worlds.


This is a common mistake among amateur traders—watching one time frame and trading another. Different time frames change everything: timing, stops, targets… EVERYTHING!!!
The weekly chart shows strong positioning with upward divergence, while the daily chart indicates the short-term move has already occurred. Coherence is crucial here. Your trading style is yours; don’t change it. Act in alignment with it and stay consistent.
Mean Reversion.


Prices tend to revert to their mean, whether trending, moving sideways, or drifting. Mean reversion is ever-present due to profit-taking, scalpers, automated systems, poor quotes from bad brokers, etc.
On the daily, prices are over two standard deviations from the mean, and the weekly is nearing that level. Entering at this point is risky. This price structure calls for either “buying the dip”. These are style choices.
Time.
If nothing happens and time passes… the market is speaking.

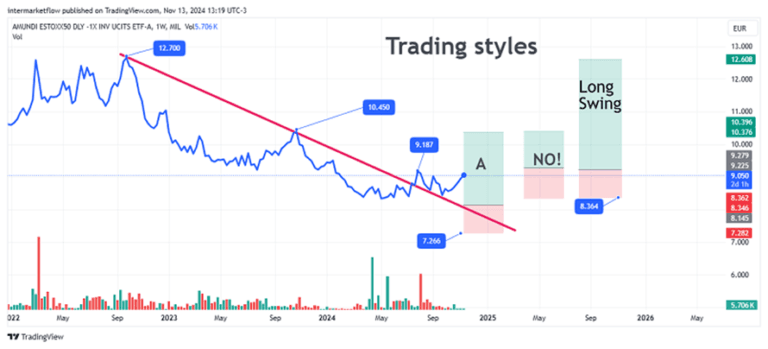
Entry Points: Weekly Time Frame
Entry points vary across styles and horizons. Ensure a 3:1 P/L and consistency between horizon, stops, and targets.

In the chart, we have the classic “buying the dip” strategy (A), highlighting the level we would look for to implement this approach. A bad trade set up, we consider this an error. Lastly, the entry point for long swingers is marked.
That’s all for now. Enjoy this piece, as it is exclusive for subscribers. You can find us at intermarketflow.com and on X @intermarketflow
Watch Animal Planet. The best traders in the world are there, trading for their lives every day!
See you soon,
Martin
Intermarketflow.com
- Intermarketflow
