Intermarket Analysis Throught Macro and Technical Methods
Trading Strategy for new home market
Vehicles to Trade the New Home Market
This stems from what we discussed and argued here. It’s the macro foundation that guides us to this micro analysis to trade de new home market.
Scenario 1:
Prices drop but don’t reach the critical crisis level (prices > mortgage value). We trade builders with exposure to inventory value.
Scenario 2:
Prices correct to crisis levels, where the asset is worth less than the mortgage supporting it. We will trade the lenders holding these mortgages.
Scenario 1: Micro Analysis of Companies in the new home market
We analyzed public data as of June 2024, for three new residential home construction. Here’s what we found.
The differences between companies are very pronounced.
What we are looking for, according to our hypothesis, is inefficiency in inventory management.
There are two companies particularly exposed to a drop in new residential home prices.
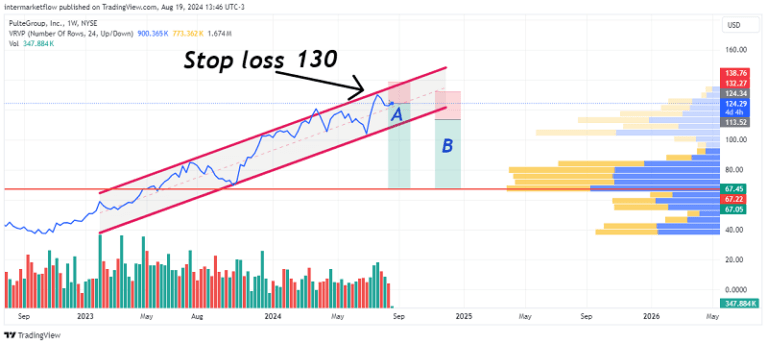
A technical look at Pulte Group
A sharp decline in new residential home prices directly impacts their value because the existing inventory they hold is very large.
Inventories are expressed in units, either completed or in progress, in stock, and unsold. PulteGroup reported having an inventory of $12.302 billion in homes and land. However, a specific breakdown of the exact number of fully completed and unsold homes was not provided in this report. We estimate using average prices.
We are anticipating a failed new high arround 130. The lack of volume in the last upward move indicates a weak trend, and we plan to trade on that.
The movement is overextended and far from the area where the market perceives value.
Trading the New Home Market
Two styles. Very different in terms of the risk assumed.
That’s all for now. Over the course of the week, we will be sending set-ups on other vehicles that we consider relevant to operate our hypothesis. Remember, these are our trades. They are not recommendations. We present them purely for marketing purposes.
As always, it’s been a pleasure. You know you can find us on X or at intermarketflow.com.