
What Changed Since the Weekly Report?
Our diagnosis has been consistent:
- The market remains in a Hands-Out regime.
- It is neither Risk-On nor conventional Risk-Off.
- It is Risk-Out: capital is still unwilling to commit broadly to risk.
- For months, declining participation has eroded market depth, leaving prices increasingly vulnerable to statistically extreme overshooting moves. This was not identified after the fact; it was one of the explicit risks highlighted in our previous reports.
- We also identified the Russell 2000 as particularly vulnerable because of weaker balance sheets, greater dependence on external financing and higher sensitivity to the cost of capital.
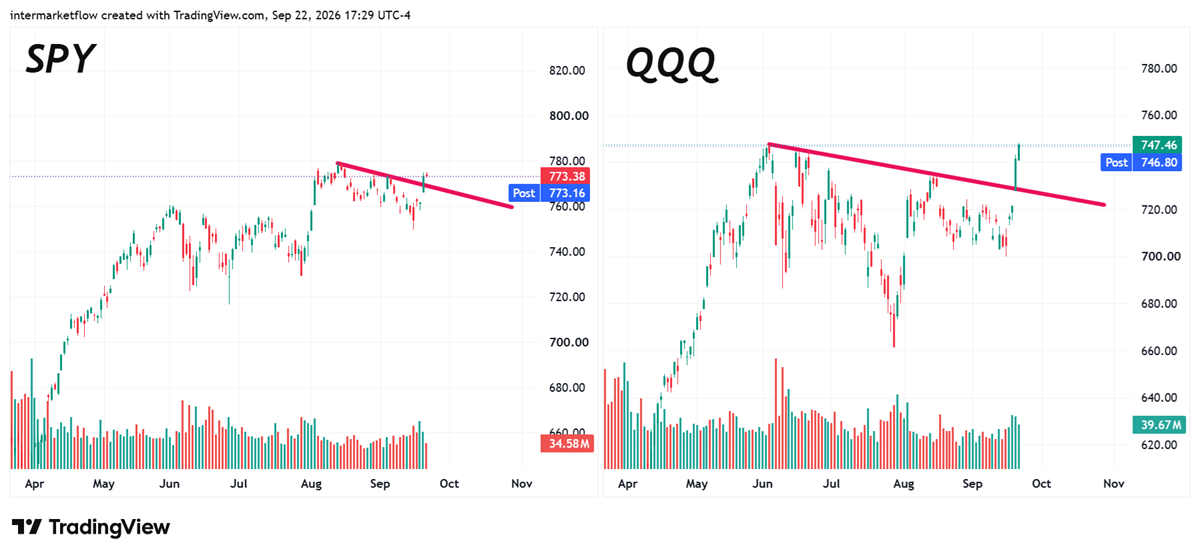
Against that backdrop, yesterday produced the following price action.
That leaves one central question
Has the market genuinely transitioned from a thin and fragile Hands-Out regime into a broad and sustainable Risk-On environment—or have prices simply moved ahead of participation once again?
At the surface, the answer appears unequivocally bullish:
- QQQ has reached a new all-time high.
- SPY is approaching its own record high.
But record prices do not confirm a regime change. For that, the underlying structure must validate the move.
Market Regime From a Risk Perspective
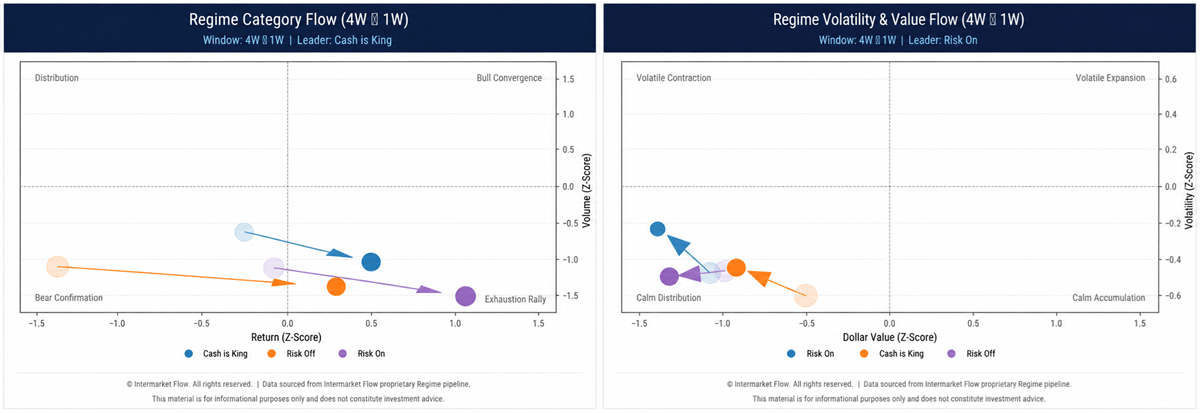
How to Read: Each arrow tracks a regime’s transition from 4W to 1W. The left panel compares return and volume Z-scores; the right compares dollar value and volatility. Movement to the right or upward indicates improvement, while negative readings show conditions below each regime’s historical norm.
- Risk-On shows the strongest improvement in returns from 4W to 1W, but the move lacks participation.
- Volume is approximately −1.5σ below its historical mean and deteriorating across all three regimes.
- Dollar value remains deeply negative.
- Risk-On volatility is beginning to rise. That signal can carry several interpretations. Its meaning depends on how it interacts with returns, volume and dollar value.
- Taken together, the evidence does not confirm a healthy Risk-On transition. Prices are advancing while participation and capital flows move in the opposite direction—a structure more consistent with an exhaustion rally inside a persistent Hands-Out regime.
- Technicians call this a bearish divergence: prices are rising while volume is declining.
Intermarket Regime Perspective
We move from the monthly timeframe toward the daily, measuring how statistically normal or abnormal returns, volatility and volume are relative to each asset’s own history.
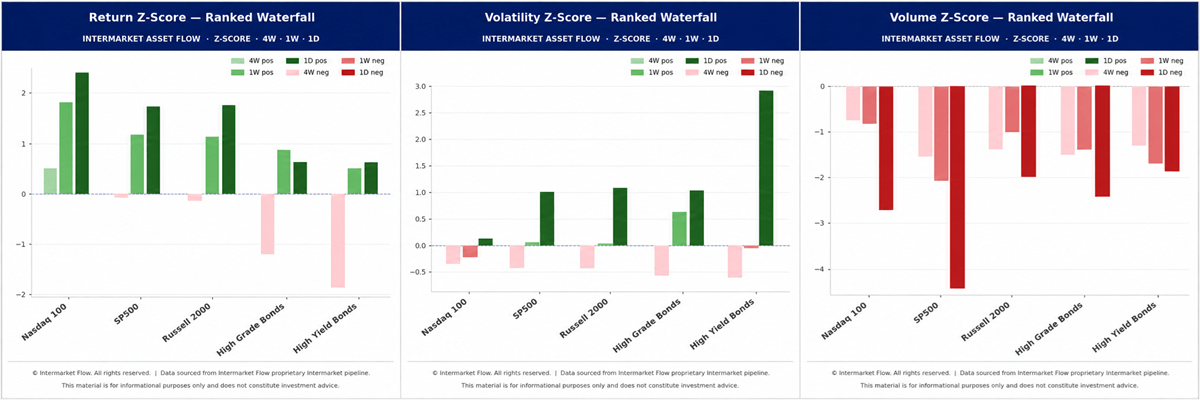
How to Read: The three charts show returns, volatility and volume. Each bar represents a Z-score for one of the three timeframes: 4W, 1W or 1D. Darker bars indicate shorter timeframes, while readings beyond ±1.5σ are statistically unusual.
- Returns: Equity returns are materially above their historical norms. The latest Nasdaq’s daily return exceeds +2σ, while nearly every major asset advanced over the past week.
- Volatility: Daily high-yield volatility approaches +3σ. This is not necessarily a short signal, but it is a statistically extreme reading—and a significant warning flag.
- Volume: Participation directly contradicts the price action. Daily S&P 500 volume is approximately −3σ, while Nasdaq volume is also close to −3σ relative to its own historical distribution.
This is the structure beneath yesterday’s advance: Statistically extraordinary gains occurring amid exceptionally low participation—a thin-market structure that amplifies price movements and undermines their sustainability.
Does this resemble a healthy Risk-On—or near-Goldilocks—regime?
From a Macro-Cycle and Sector Perspective
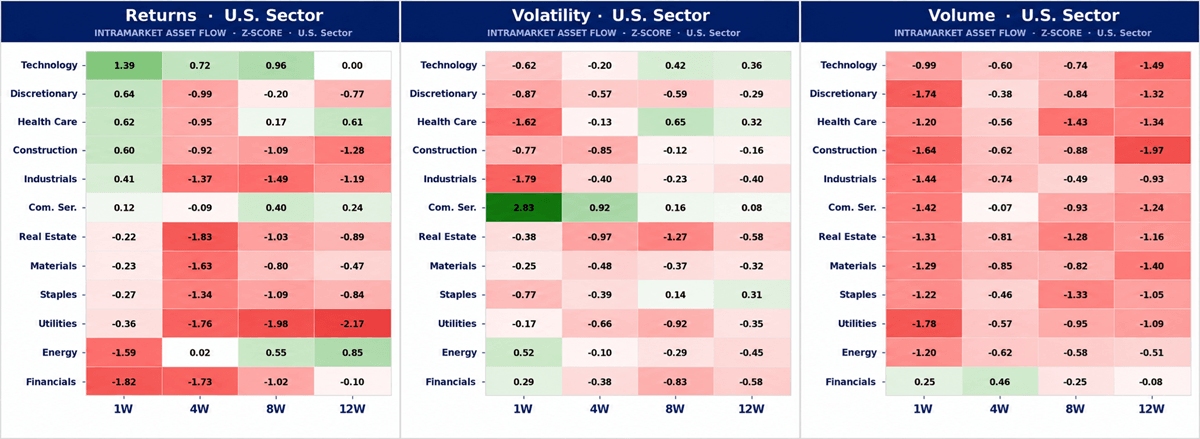
Financials: The Missing Foundation of Risk-On
- A sustainable Risk-On regime requires financials. They are the transmission channel for credit creation, liquidity and economic activity.
- Yet financials posted a statistically significant −1.82σ weekly negative return.
- Volatility remains normal, but volume has recovered toward its historical average. That is bearish confirmation: selling pressure is increasing as participation returns.
- In a market starved of volume, a .25σ normal participation is not noise. It is evidence of genuine stress in the sector required to validate Risk-On. Until financials confirm, the broader rally remains structurally incomplete.
Volatility Regime
We now assess market-implied risk through two complementary forward-looking volatility measures.
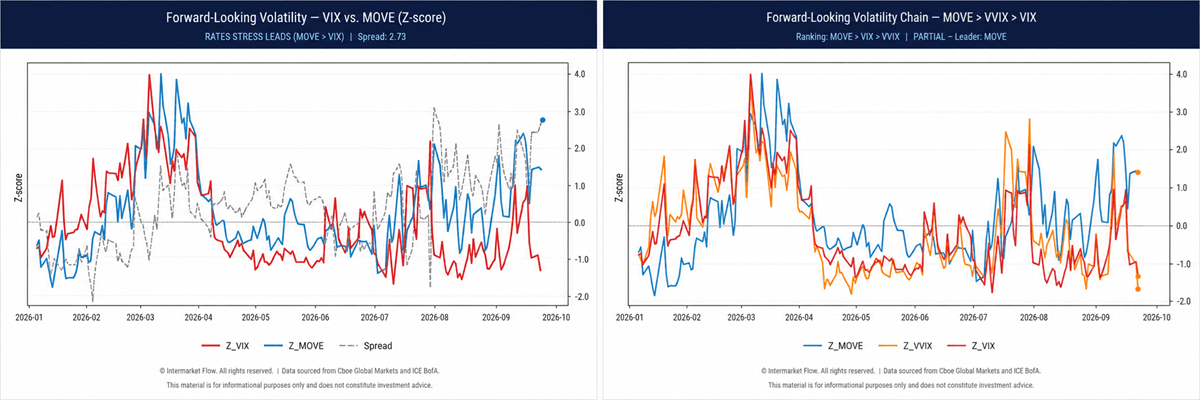
- The volatility differential between bonds and equities is approaching its annual high.
- MOVE is rising while VIX collapses. MOVE leads, as always.
- VVIX is falling even faster, showing aggressive compression in expected volatility-of-volatility.
The equity market is pricing calm and virtually no expectation of turbulence while rates volatility sends the opposite message.
Course of Action
Nothing has changed.
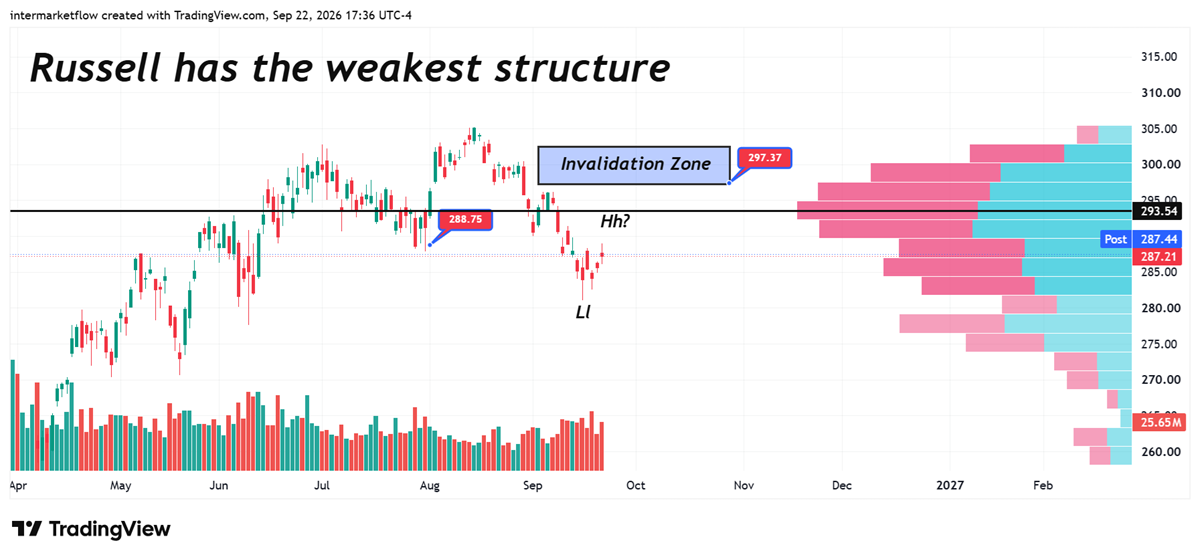
This chart continues the framework used throughout recent reports as our broad measure of current risk conditions.
- The Nasdaq and S&P 500 advances do not confirm a healthy Risk-On regime.
- They are consistent with the overshooting mechanism identified in previous reports: limited inflows entering a structurally thin market and producing statistically outsized returns.
- The strategy remains unchanged: trade short-term mean reversion, reduce position size, target small credit sensitive sectors and companies. Operational risk, high beta in an environment of higher rates are highly exposed.
Set-ups
Technical Perspective
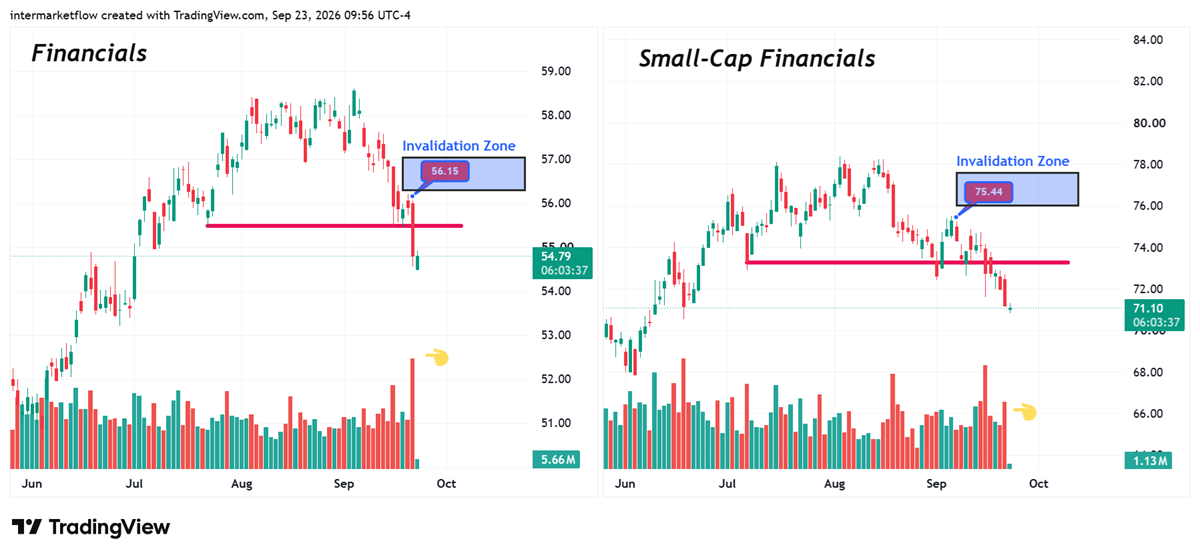
- These assets remain in daily downtrends. The setup technically requires a retest of previously broken support—now acting as resistance—before considering entry.
- The invalidation zones are clearly defined.
IWM remains the primary confirmation chart because it should reflect any underlying change in small-cap risk appetite before the individual vehicles do.
The following section—detailing the exact asset classes showing structural failure, the specific vulnerability vehicles (including balance sheet stress metrics), and the precise short-volatility / mean-reversion execution levels—is reserved for Intermarket Flow paid subscribers.
Join the Desk
Intermarket Flow
If you believe this is an error, please contact the administrator.