Intermarket Analysis Throught Macro and Technical Methods
16# New home Construction Market.
Macro-Micro and Technical Analysis to trade the new home market.
Analyzing the New home construction market, in the search for setups and trades, based on our hypothesis about the existing imbalance (more here), we found this. We included an analysis projecting one year forward to get a more complete picture. Here’s what we discovered.
Building permits
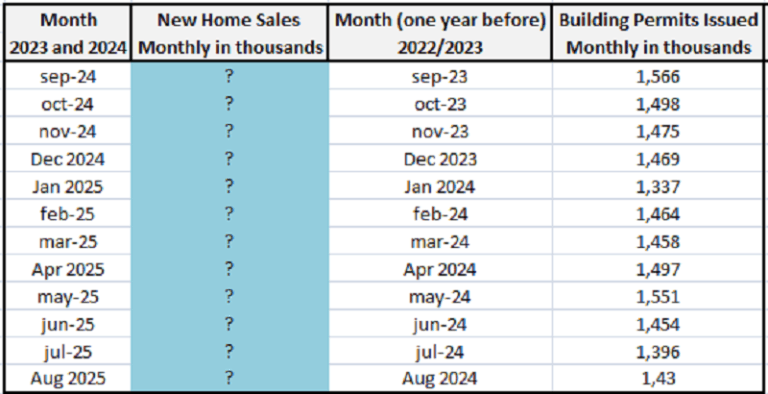
From Aug-22 to Aug-23 vs. New Home sales from Aug-23 to Aug-24.
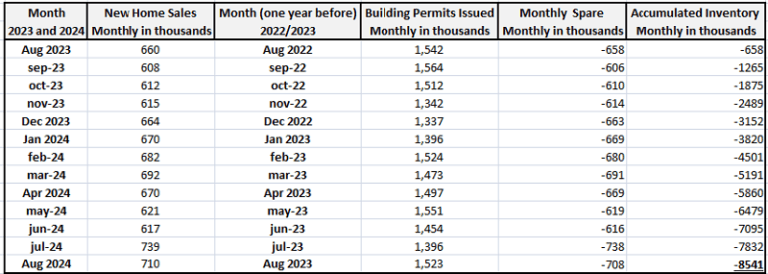
Today, the market has an unsold stock of 8,541,000 units. After adjusting this number for the usual historical shrinkage (30%), we arrive at a more realistic total of 5,978,000 units in stock, while approximately 700,000 units are being sold per month. If we stop building today, we have 8.5 months’ worth of sales inventory.
Building Permits as a leading indicator.
Permits have the unique characteristic of being an excellent leading indicator. The construction process takes on average 12 months, so they anticipate the construction of a unit by 12 months, allowing us to forecast the supply. That is, until August 2025.
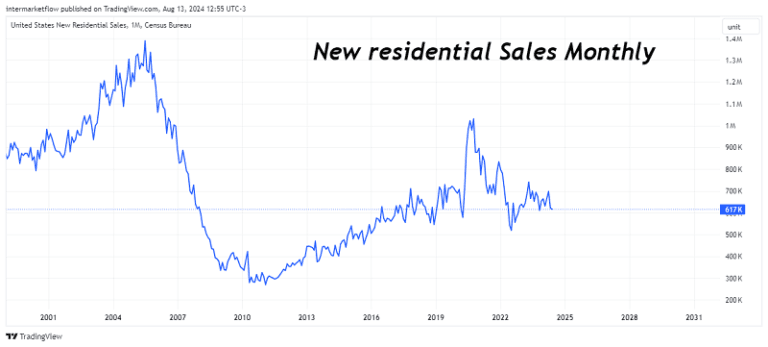
New home sales
The macroeconomic fundamentals underpinning our analysis
The macro pillars supporting our thesis. That the return to equilibrium will occur through a price adjustment rather than a quantity adjustment.
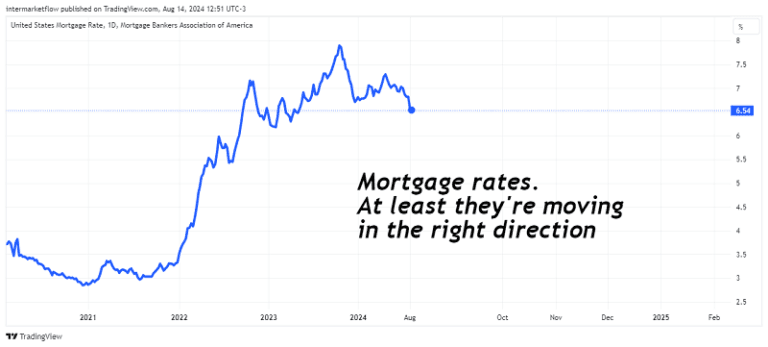
1.Mortgage Rates
Mortgage rates are starting to decrease, but they remain extremely high compared to the near future.
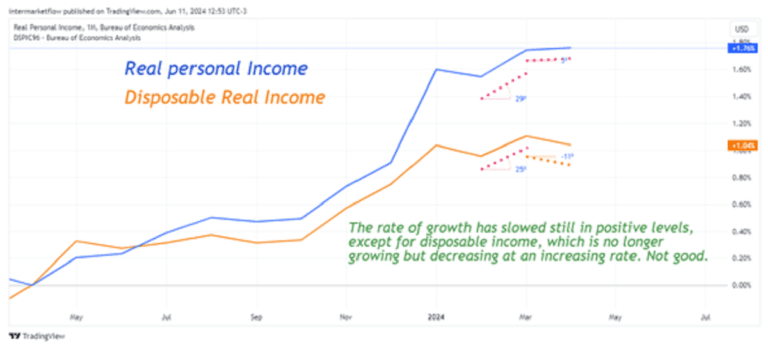
2. Real Disposable Income
Real disposable income has been accumulating “declines” since inflation exceeded the annual 2% target. Even today, we have not managed to return to this goal.
3. Entry of New BuyersThe entry of new buyers into the new home market is unlikely. Many current homeowners enjoy fixed-rate mortgages at 2-3%. Why leave such a comfortable and convenient situation?
Given all these variables and the existing overstock, combined with the fact that this market is naturally slow to adjust by quantities, we believe a price adjustment is inevitable.
Macro-Micro and Technical Analysis to trade it.
“The big 10”
We seek exposure to Inventory
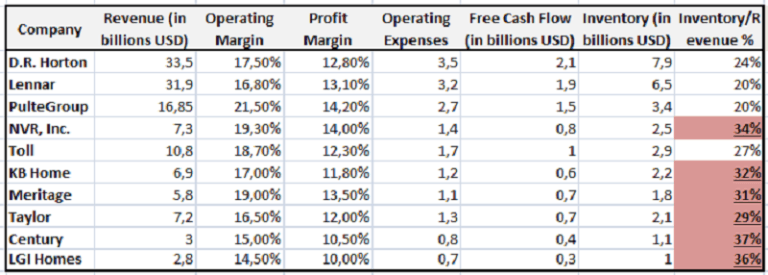
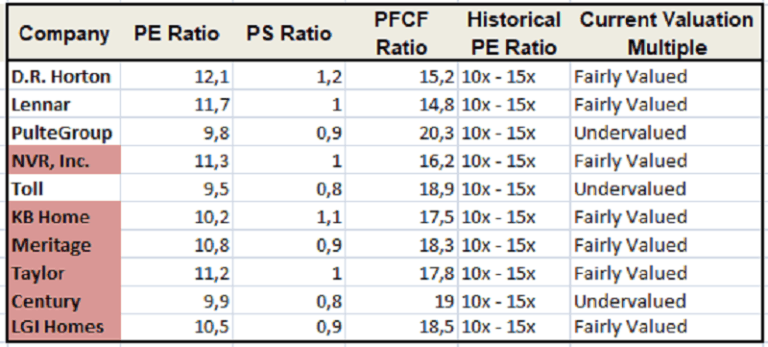
Valuations vs. Historical Valuations
We are looking for our vehicle with:
- Exposure to inventory (poor inventory management).
- Funding issues arising from the slowdown in sales.
NVR, Inc., Century Communities, and LGI Homes are the companies to investigate as they have the highest percentage of inventory relative to their sales. It will take them longer to rotate their stock, which will decrease their cash flow and negatively impact their stock valuation.
NVR Inc
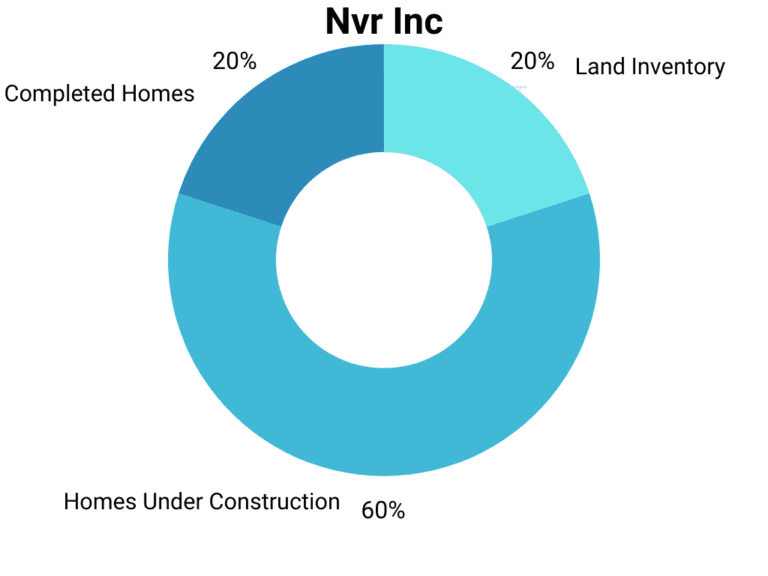
Eighty percent of their inventory is exposed to the price of new homes. This company has the unique characteristic of funding itself through customer deposits, which reduces its need for other financing sources. While it’s expected that their business volume will adjust, they shouldn’t face liquidity issues.
Century Communities
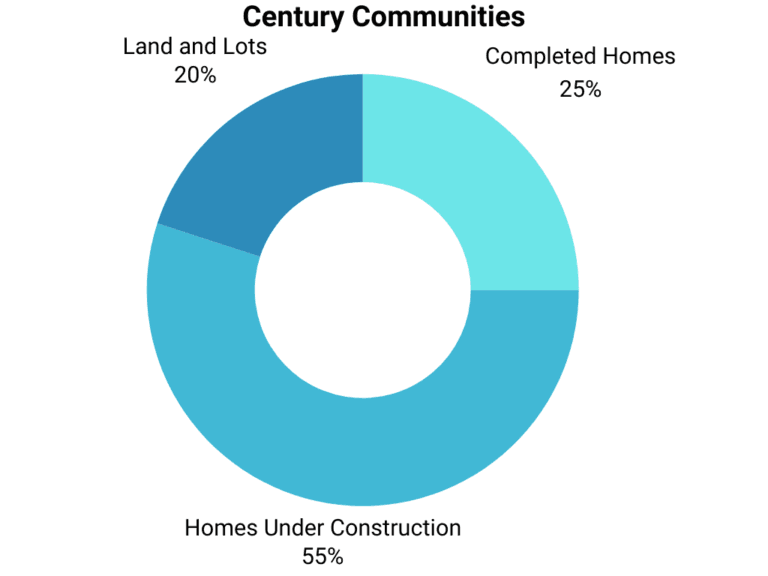
The situation with inventories is very similar. However, this company relies on its cash flow as a central funding mechanism. That cash flow is expected to slow down with a tendency to decrease relative to previous expectations. The company is exposed to liquidity bottlenecks, which could further force a price adjustment on its inventory. At first glance, it faces a double threat in the current context: inventory and liquidity.
LG Homes
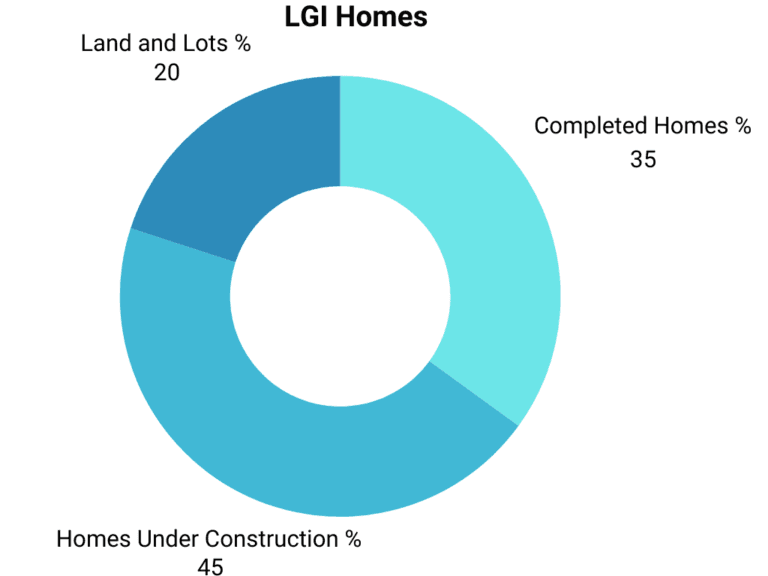
It funds itself through sales. This company is already experiencing the effects of the sales slowdown, resulting in decreased cash flow. It is also exposed to liquidity issues.
Not all companies have the same operational funding format. However, in the scenario we’ve outlined, all of them will find it difficult to secure financing and even harder to sell their inventory. These companies are not operating in a friendly environment, and their current valuations do not reflect this situation. There are opportunities to capitalize on both at the sector and individual levels.
Macro-Micro and Technical Analysis to the new home market.
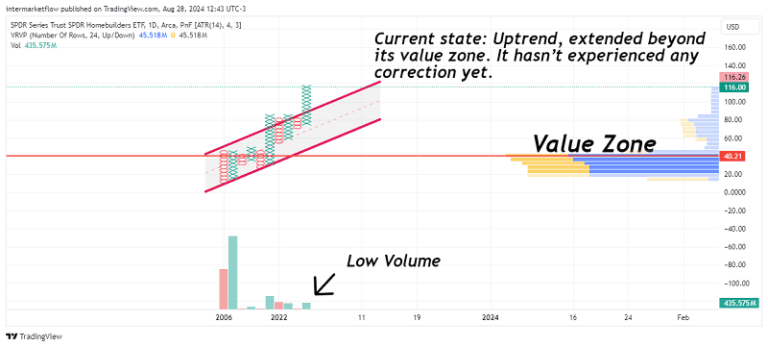
The construction Sector: ETF XHB
Including time in the analysis of the new home sales.
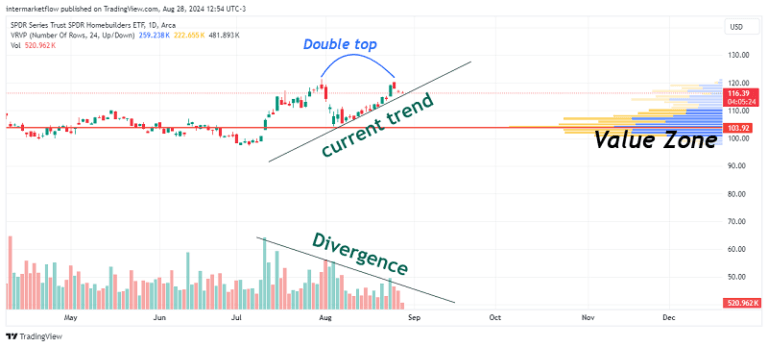
Analyzing the asset from a trend perspective, it’s clear that it is in an overextended and weakened uptrend. The divergence is significant, and the double top allows you to quantify entry points, stops, and position size.
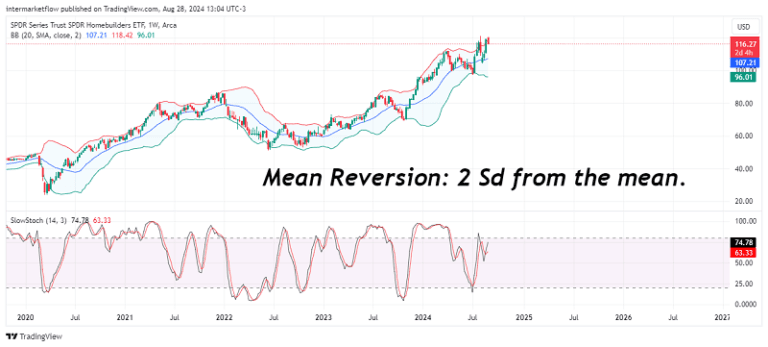
Mean Reversion: Using the weekly time frame, the asset is two standard deviations away from the mean. Furthermore, the current overextension is starting to fade due to a loss of bullish momentum.
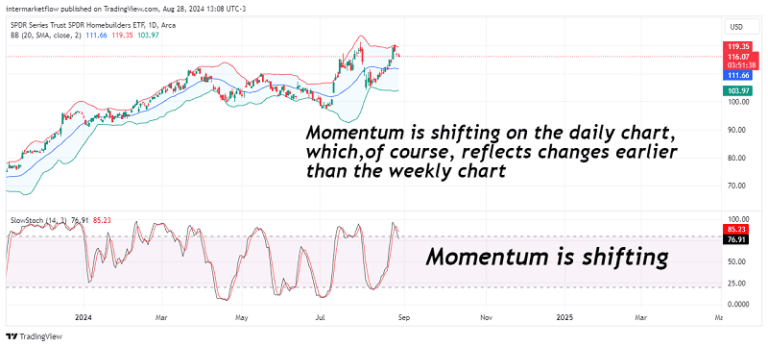
Cycles and Timing for the new home market.
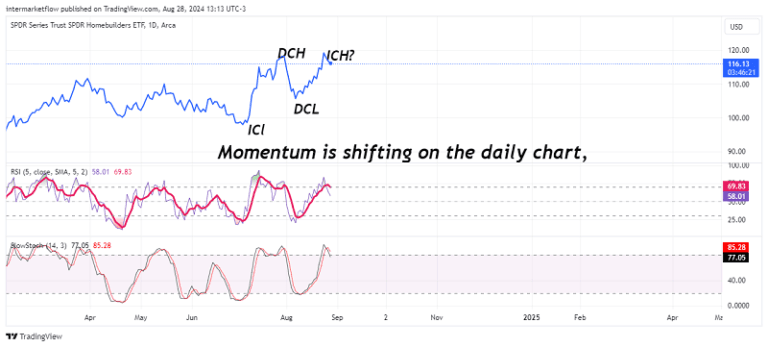
The pillars of Technical Analysis—Trend, Mean Reversion, Momentum, and Timing—are all aligned. Don’t need anything more. This asset is a sell.
When-How-What to trade in the new home sales market
ETF SRS More for trading the new home market
When trading ETFs in general, it’s crucial to understand that the chart you analyze doesn’t necessarily reflect the asset you’re actually trading. Many factors come into play, especially if these ETFs are leveraged, as in this case.
Important notes: These vehicles are expensive to hold over time; their proper use is for hedging and/or short-term trades.
The mere passage of time erodes their value due to the costs incurred in creating the synthetic structure.
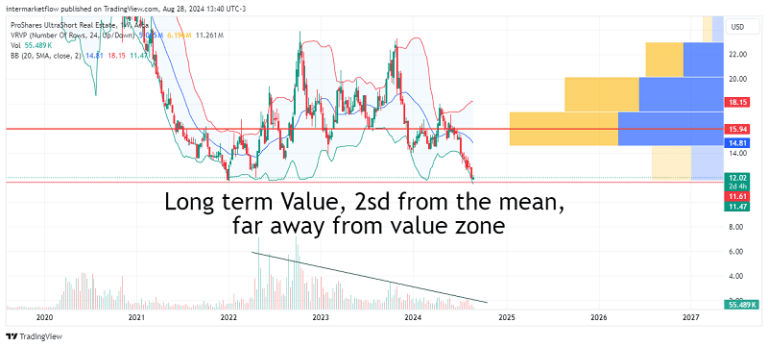
It goes without saying, the extra risk they carry. As always, this is not a recommendation. These are our trades, which we show for marketing purposes. In fact, we shorted this asset yesterday. I think it’s important for you to know that.
Action
Excellent risk-reward ratio. Those are our targets and stops.
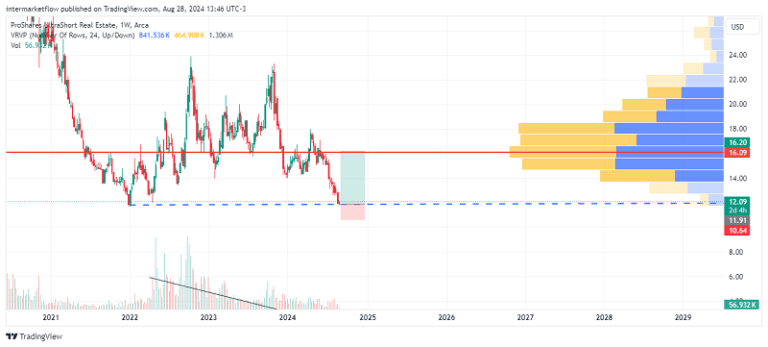
When?
After Nvidia´s earnings.
I hope you enjoyed it as much as I enjoyed writing it. Share it, subscribe, it won’t cost you anything and it will make our day. Stay in touch.
You can find us here intermarketflow.com or here X
Enjoy!
Martin
Intermarketflow.com
- Intermarketflow