
August 26 — Mid-Week Report
Market Regime: Risk-Appetite Perspective
Methodology: Market Regime Identification
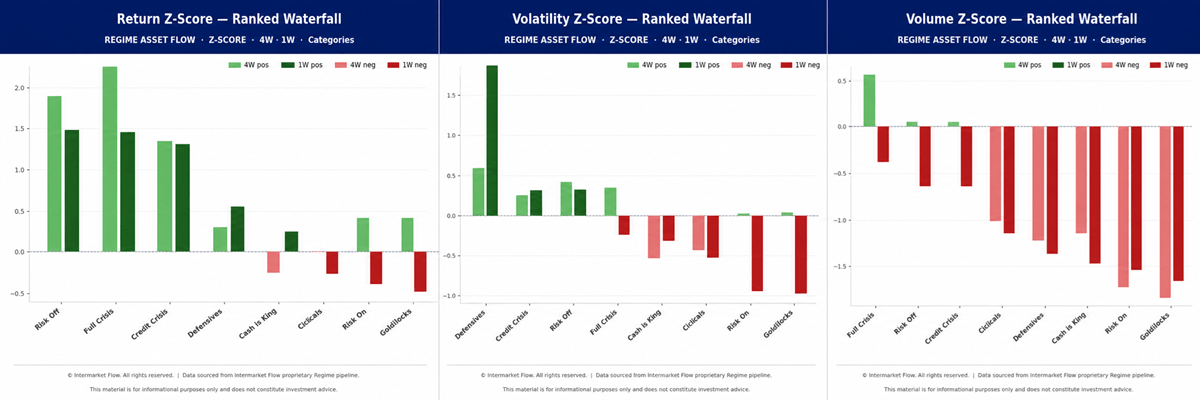
How to Read:
The 4W and 1W windows are independent snapshots. Within each window, Z-Scores standardize returns, volume, and volatility relative to their own historical distributions, making assets and variables directly comparable. Magnitude shows deviation from historical norms; comparing 4W vs. 1W tracks the evolution across time horizons for the three main variables, return, volatility and volume.
Lower Risk Appetite
- Higher returns, expanding volatility, and volume closer to historical norms. Small changes in participation are producing unusually large price reactions—consistent with high sensitivity in prices and early accumulation, but still lacking full volume confirmation.
Higher Risk Appetite
- Lower returns, compressed volatility, and much deeper volume contraction. This reflects apathy and weak participation, rather than active distribution.
Macroeconomic Regime Perspective
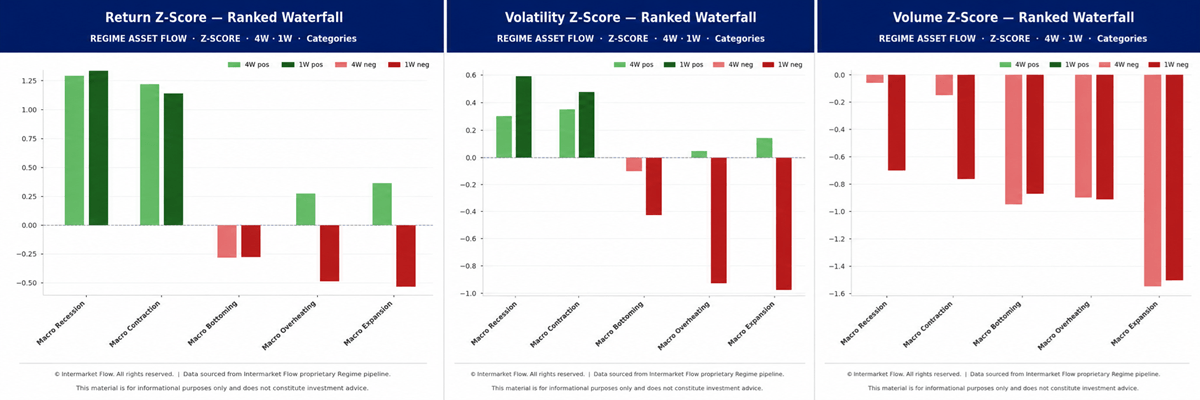
How to Read
The framework is applied independently to the macroeconomic cycle. Assets are grouped by cycle phase, evaluating returns, volatility, and volume across 1W and 4W windows.
- These are independent analytical dimensions: the prevailing market regime does not necessarily align with the stage of the real-economy macro cycle.
Facts
- The message is consistent. Macro Contraction and Macro Recession assets show the strongest returns, higher volatility, and the least severe volume contraction, closely replicating the signal observed from the risk-appetite perspective.
- Prices are expressing a market that is avoiding risk and positioning for economic contraction.
Capital Allocation Across Asset Categories — 1W and 4W
Facts
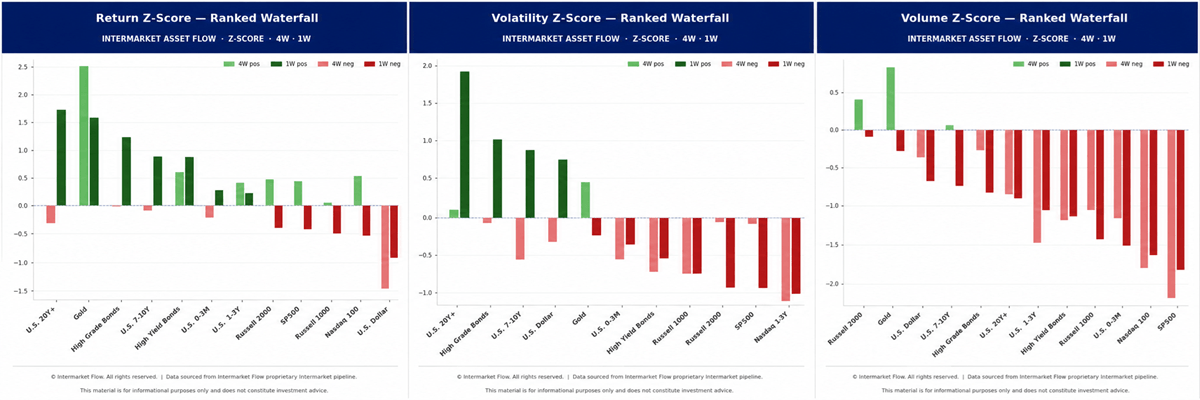
- Evaluated through capital distribution, the structure remains consistent: defensive assets continue to attract relatively stronger participation, while higher-risk assets remain characterized by weaker engagement, deeper volume contraction, and persistent volatility compression.
- Gold, inflation-sensitive sectors, and rate-sensitive assets show the strongest readings across returns, volatility, and volume.
- The ex-U.S. dollar currency basket saw a sharp surge in volume, pointing to a broad reallocation away from the dollar rather than toward a single destination.
Current participation across the weekly and monthly time frames
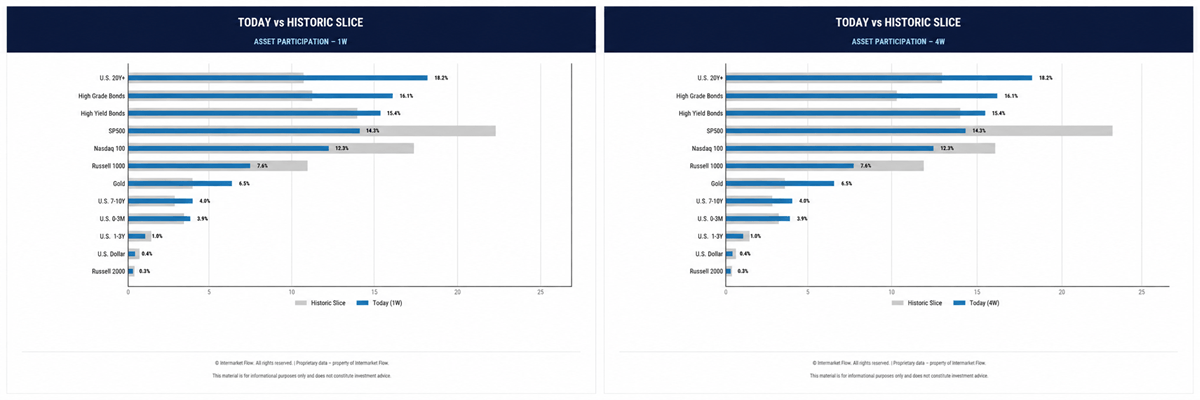
How to Read
Historic Slice shows each asset’s average historical share within the synthetic universe. Today shows its current share over independent 1W and 4W windows (Above historic = over-participation; Below = under-participation).
- The current mix shows a clear protection bias: structural overweights in defensive assets alongside underrepresentation in risk assets, following the defensive allocation logic.
Volatility
Facts
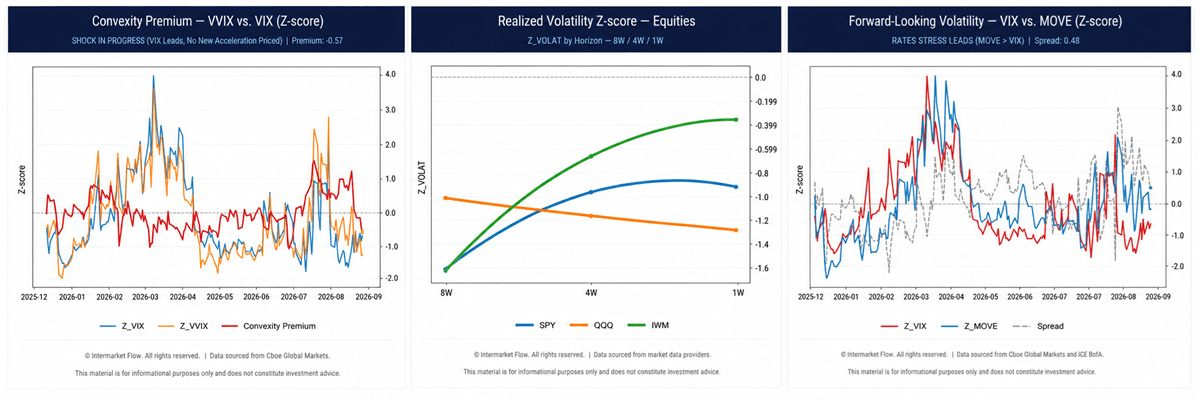
- VIX vs. VVIX: VIX has been rising without a new adjustment in its speed component (VVIX), suggesting that a repricing driven by an acceleration in VIX is still missing. (Left Chart)
- Realized Volatility: Nasdaq is the sole major equity index that has not adjusted higher at any point. The transmission path — Bonds → Equities → Russell → partial S&P 500 adjustment → none in Nasdaq — points to Nasdaq as the next link in the sequence. (Mid chart)
- Forward looking volatility: 30-day expected volatility prices higher volatility in rates than in equities, though the gap is trending lower, indicating the transmission process has started but has room to run. (Right Chart).
Asymmetric Downside Risk
- Systemic Defensive Rotation: Capital migration toward protection is visible across every analytical layer (risk appetite, macro cycle, capital allocation, and historical participation). Returns and volatility match an accumulation process.
- Hands-Out Market Structure: While specific defensive sectors benefit, the broader market remains firmly Hands-Out.
- Volume as Missing Confirmation: Returns and volatility point to accumulation in defensive assets, but volume has not yet expanded enough to provide full validation.
- Incomplete Volatility Transmission: The sequence remains Bonds → Equities → Russell → partial S&P 500 adjustment → no meaningful Nasdaq adjustment yet.
- VIX is rising without VVIX acceleration, signaling further volatility repricing ahead.
Set-ups
- Asymmetric Risk/Reward: Adding directional risk near historical valuations means fighting the prevailing flow trend with limited upside relative to potential downside adjustment.
- Gold: Remains the clearest destination for defensive capital, reinforcing the broader thesis.
- Practical Expression: Hands-Out, Risk-Off, long Gold, and bearish exposure through assets where repricing remains incomplete—specifically High Beta and Nasdaq.
Timing & Execution
- Patience is required as participation has not yet provided the confirmation needed for aggressive positioning.
Strategic Takeaway
- Capital is positioned defensively while growth-sensitive assets still face structural volatility repricing, making them the most exposed vehicles and the most efficient instruments for expressing a bearish context.
- Asymmetric downside probability leads the way and requires action at both the portfolio allocation and trading levels.
The market operates under a constant stream of noise, short-term narratives, and conflicting incentives. Our methodology strips that interference away at the source, using Z-Scores, capital flows, and statistical evidence to separate signal from bias.
The result is a more objective framework for understanding where capital is moving, how risk is being repriced, and where the market sits within the broader cycle.
Join the Intermarket Flow Desk and get full access to institutional-grade intermarket research.
Intermarket Flow
If you believe this is an error, please contact the administrator.