
Intermarket Analysis: Credit Stress Beneath Record Equity Highs
Our recent reports have tracked a growing body of evidence as intermarket transmission continues to advance.Where We Stand
- A credit crisis is unfolding beneath the broad bond selloff.
- Repricing remains incomplete: major equity indexes have yet to fully reflect the yield curve shift.
- Volatility divergence persists: the extreme MOVE–VIX gap remains, while small-cap volatility rises against broader equity compression.
- Transmission is advancing through two channels: from bonds through high-yield credit to small caps, and from bonds to utilities.
The Market from Risk attitude Perspective
How to Read- Bars run 8W → 4W → 1W, from bottom to top. They measure trading volume, not returns or net capital flows.
- Left: volume above or below its historical average, expressed as a percentage.
- Right: how unusual that volume size is relative to its history, measured in Z-scores.
The Market from a Safety vs. Risk Perspective
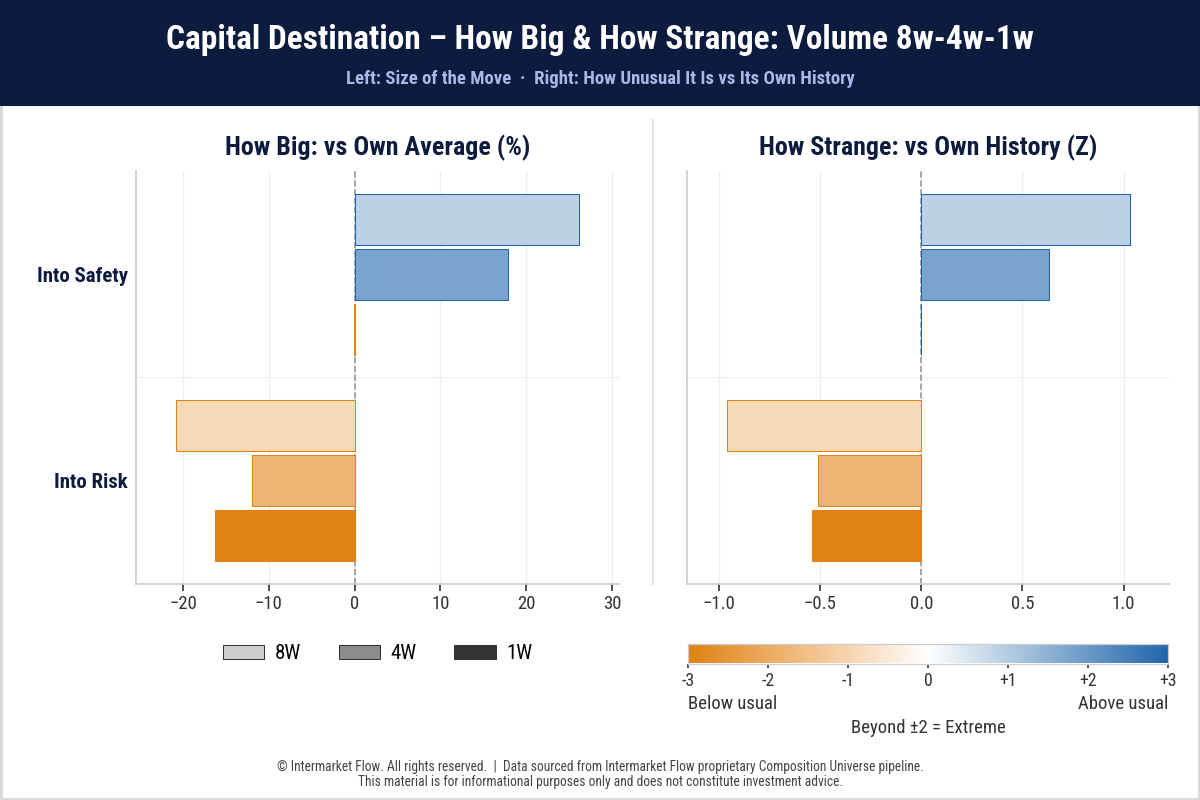
- Combined trading volume in safety-oriented assets across the 8W, 4W, and 1W windows shows how the search for shelter has evolved over the past two months.
- Momentum is accelerating: volume growth picked up in the latest week, reaching twice the pace measured over the full month.
- The acceleration is unusual, but not statistically extreme: it stands one standard deviation above its historical mean.
- Trading volume in risk-taking assets confirms the picture, showing the other side of the same pattern.
Hands Out and Risk-Off
- They sit close together on the risk-appetite spectrum, but they are not the same.
- In a healthy Risk-Off rotation, investors still seek returns in an economy that is slowing but remains healthy.
- They are adjusting their risk profile, rather than seeking immediate liquidity.
Credit Stress: From High Yield to Equities
- From 4W to 1W, the main risk assets show a clear pattern: weaker flows, thinner trading volume, and weaker returns across high-beta-growth, and leveraged products, including 3× leveraged ETFs.
- Keep in mind that below-average volume Z-scores, week after week, mean total weekly trading activity consistently falls below its historical average. This has persisted for months, reducing market depth and making prices more sensitive to order flow.
- Returns and volatility must be interpreted in this context, because their behavior and reactions differ from those in deep, robust markets.
- For the same asset, a 1% return in a thin market does not carry the same meaning as a 1% return in a deep market. The same applies to volatility.
- Weaker returns accompanied by weaker volume are what technicians call a bearish convergence.
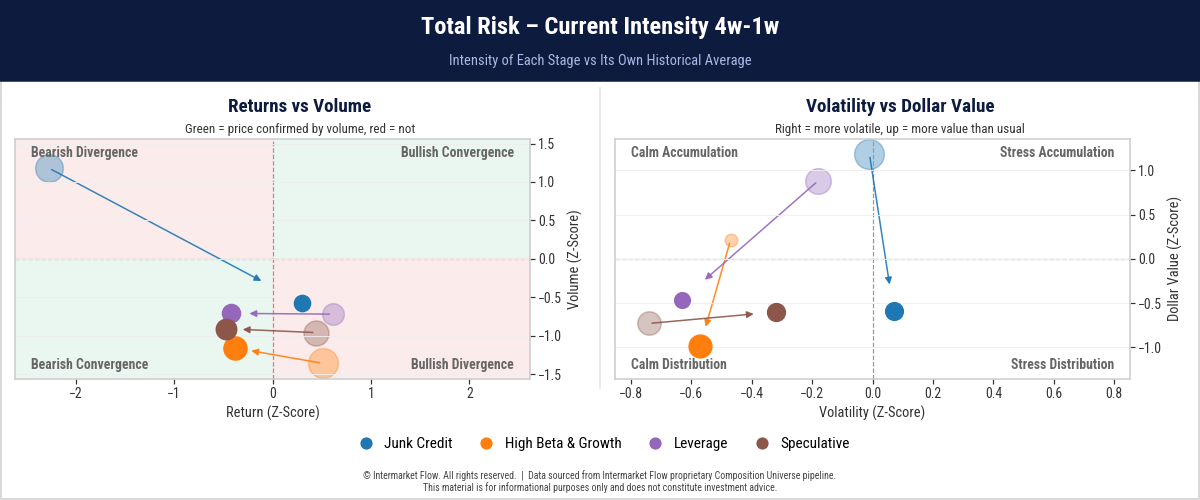
High-yield credit tells the sharper story
- The 4W bubble for returns and volume shows an explosion in trading volume, with a Z-score of +1.5𝜕 and a return Z-score below 2𝛛. This summarizes the month’s return and trading activity. That is a run.
- It is not yet a stampede—for that, we need a volume Z-score above +2𝛛.
- Identifying this high-yield run is the difficult part, because it is masked by a stampede across the broader bond category as duration adjusts to the shift in the yield curve.
- Over the past week, we have seen a technical rebound, as expected after a run of this magnitude and the short covering it triggers.
- Of course, this correction comes with a collapse in trading volume.
Markets from a Macro Fundamentals view
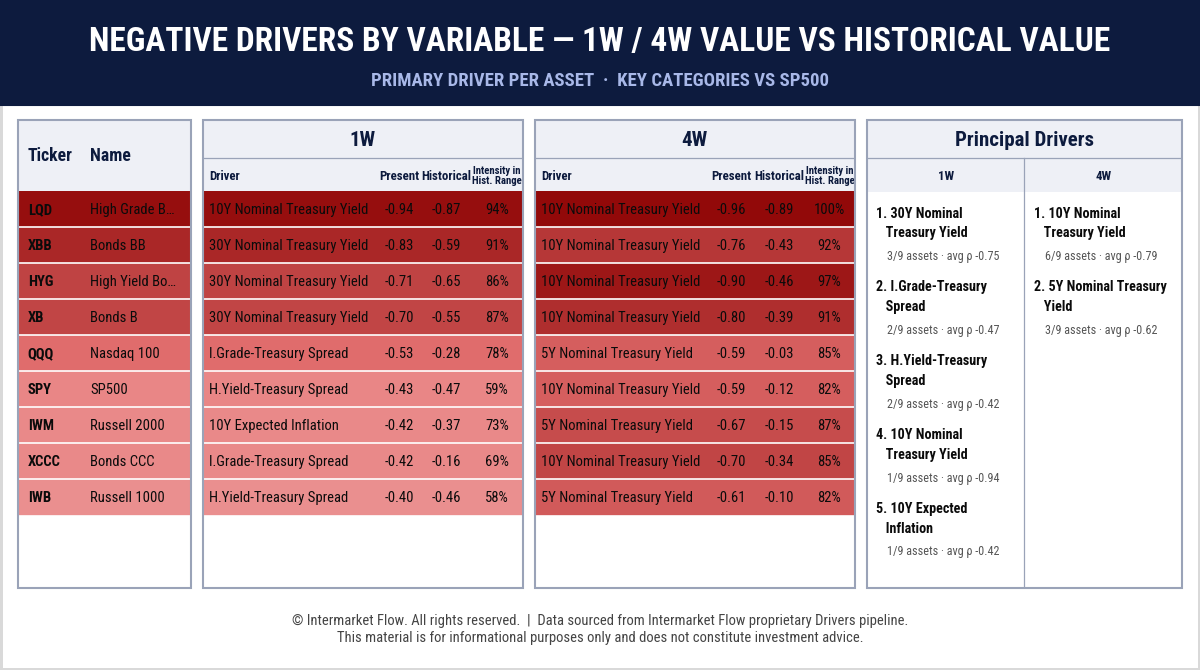
Monthly
- The 10-year nominal yield overwhelmingly dominates the market. Across some assets, its correlation ranks between the 90th and 100th percentiles of its historical distribution, placing these relationships near or at historical extremes.
- For high-grade bonds, the current correlation has surpassed its previous historical peak. A correlation coefficient of 0.96 shows that high-grade bonds are moving almost perfectly in sync with the 10-year yield.
Weekly timeframe, the drivers begin to shift
- The 30-year nominal yield is emerging as a driver, displacing the 10-year.
- Credit spreads over Treasuries are also coming into focus.
- Both high-yield and high-grade bonds spreads reflect greater perceived credit risk—another symptom of the developing credit crisis.
- Importantly, the stress is no longer confined to high yield: high-grade bonds are beginning to feel it too. Another intermarket transmission link: from high yield to high grade.
From a Volatility Perspective
Recent Past volatility
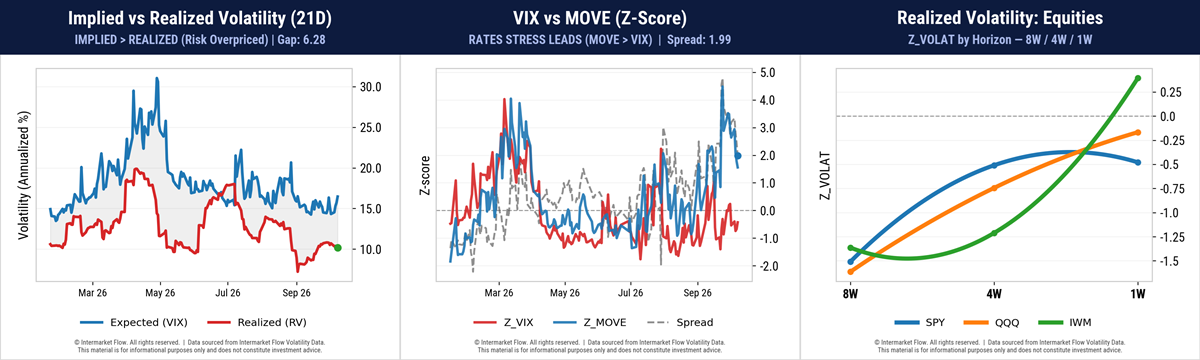
- The gap between realized volatility and the 30-day expected volatility at the same point in time reflects the persistent unease the market has been living with.
- The market consistently expects far more volatility than actually materializes. (First Chart).
- Russell 2000 realized volatility is rising at an accelerating pace, as the final chart shows. (Last Chart).
- Nasdaq volatility is rising, though at a slowing pace, while S&P 500 volatility restarts compression from already subdued levels.
Forward-looking volatility (Middle chart)
- The gap between expected bond and equity volatility over the next 30 days remains near its highs.
- Expected bond volatility is easing today, but its level remains well above expected equity volatility over the next 30 days.
- Higher volatility in rates than in equities reveals a market asymmetry.
Course of Action: A Technical Perspective on Market Structures
The major indexes are at all-time highs amid a bearish divergence that began in March 2026.The Market’s Main Misalignment.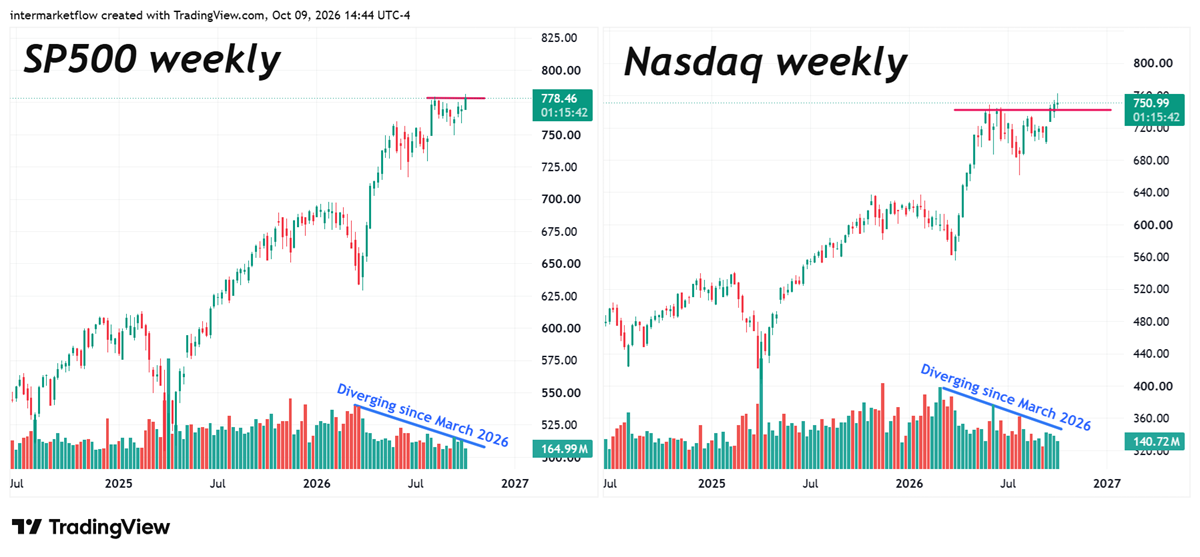
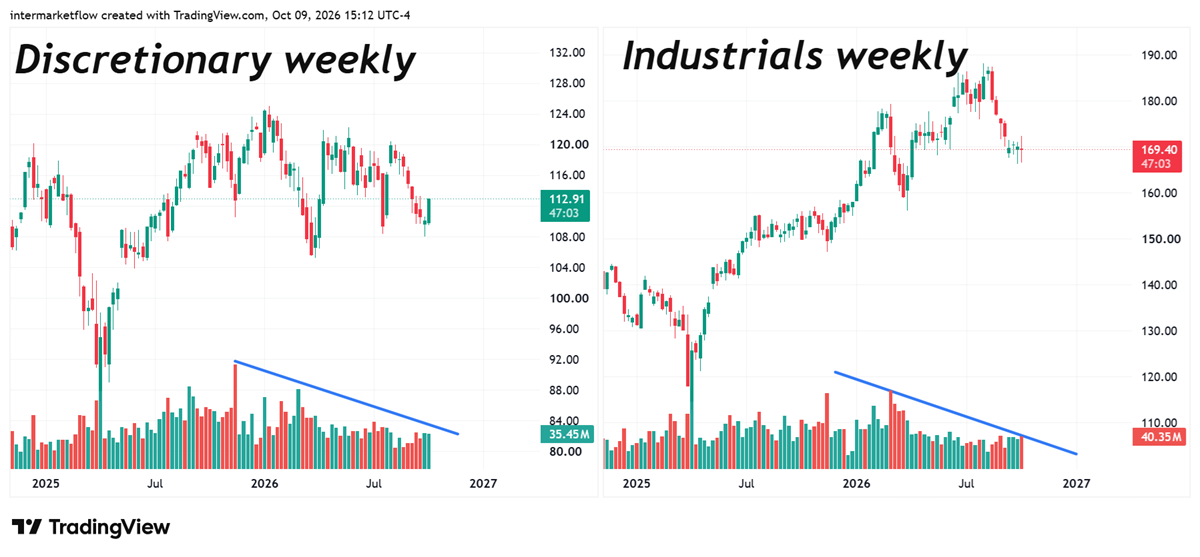
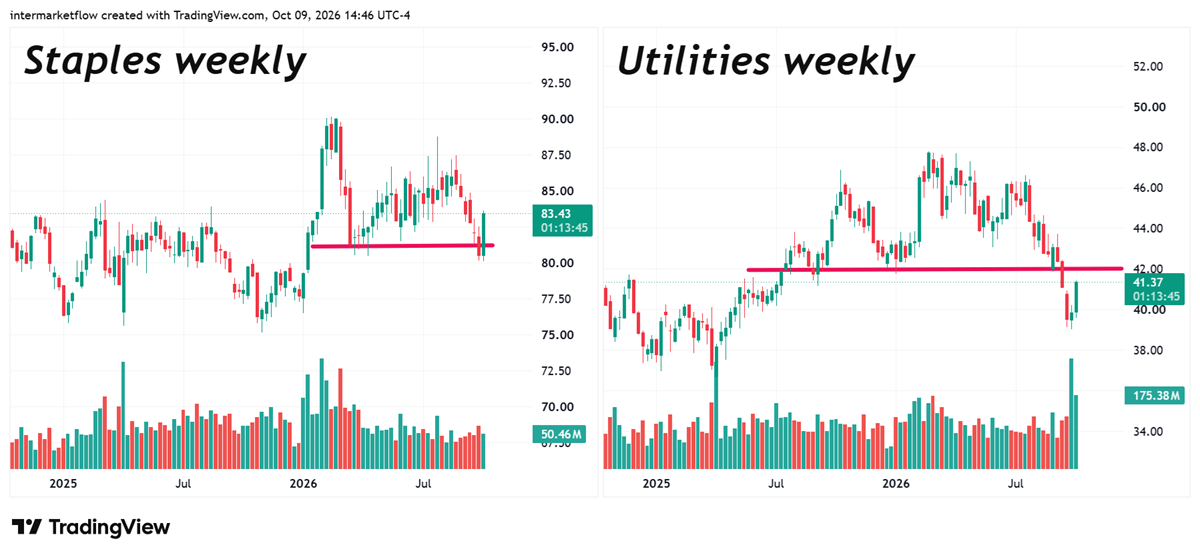
Not risk on, not risk off, Hand Out!!!!
Interest-rate-sensitive sectors are starting to show pain. But weakness reflects a different price–volume relationship.This is Weakness.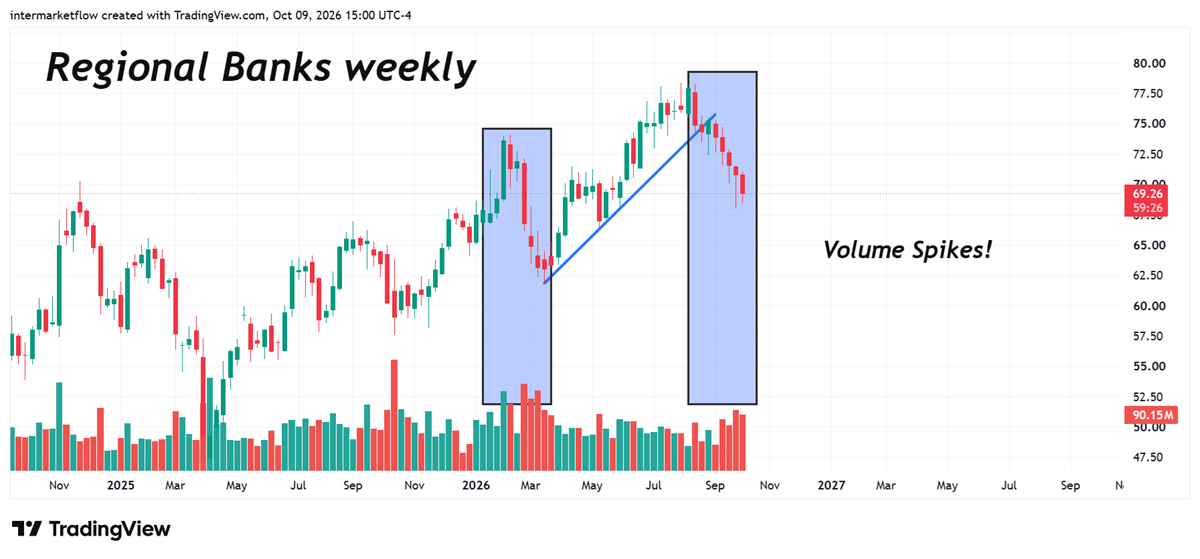
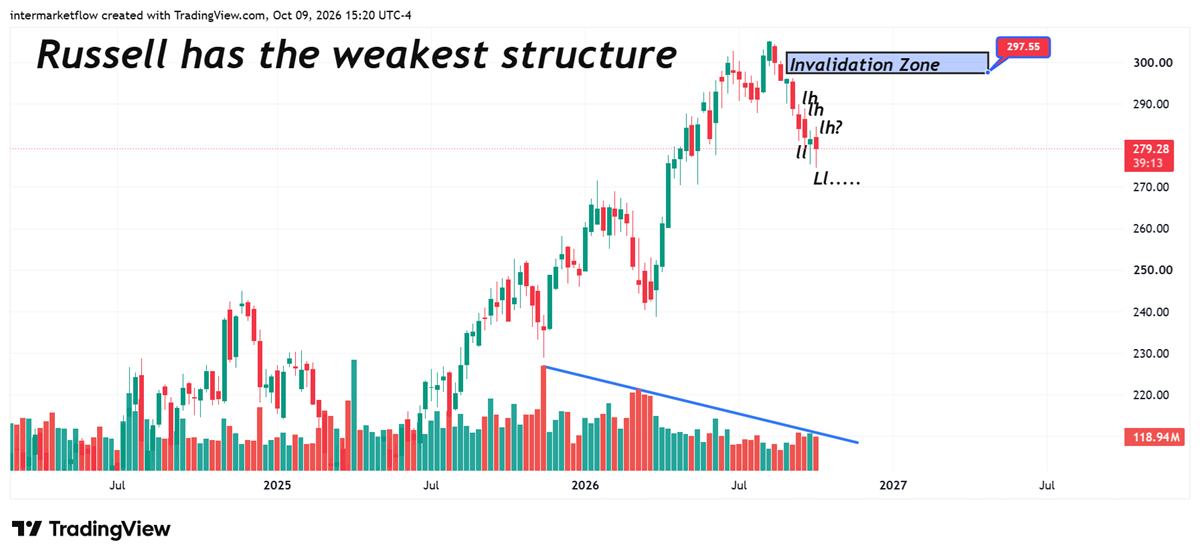
Course of Action
Two distinct potential setups are emerging, each requiring a different technical approach.1. Trying to Catch the Top
- Extremely risky: tops are processes, not events. The grind higher can persist for months because of the size and influence of today’s options market.
- This was not the case in the past, and it is one of the most significant changes in market structure in recent years.
- Technically, this requires a different set of indicators. The central signal is a trend reversal, not mean reversion.
- Volume divergence confirms it, while market structure and its successive confirmations determine the timing.
2. Portfolio Management
- Managing risk today means holding liquidity. It protects capital and preserves the ability to act on the opportunities ahead.
- The intermarket transmission from bonds to equities now includes high-grade bonds, which are also under stress and transmitting it to equities. Another piece of evidence in the growing case.
- Credit stress is spreading. Follow the intermarket transmission, understand what confirms the next move, and see where opportunities are emerging.
OR
UPGRADE
Free trial has expired.
If you believe this is an error, please contact the administrator.
If you believe this is an error, please contact the administrator.
OR
UPGRADE