#3 Technical Analysis: Homebuilding vs Real Estate: the Divergence No One’s Talking About
Here you’ll find: How Homebuilder and Real Estate sectors diverged since the yield curve inversion, relative to the S&P 500 Equal Weight The evolution of U.S. housing starts over the same period Market data showing the imbalance between supply, demand, and existing inventory Sector statistics highlighting the companies with the sharpest capital outflows Technical snapshots […]
#2 T.A: XLF, the financial sector, midweek pure technical and complete set up for INBK
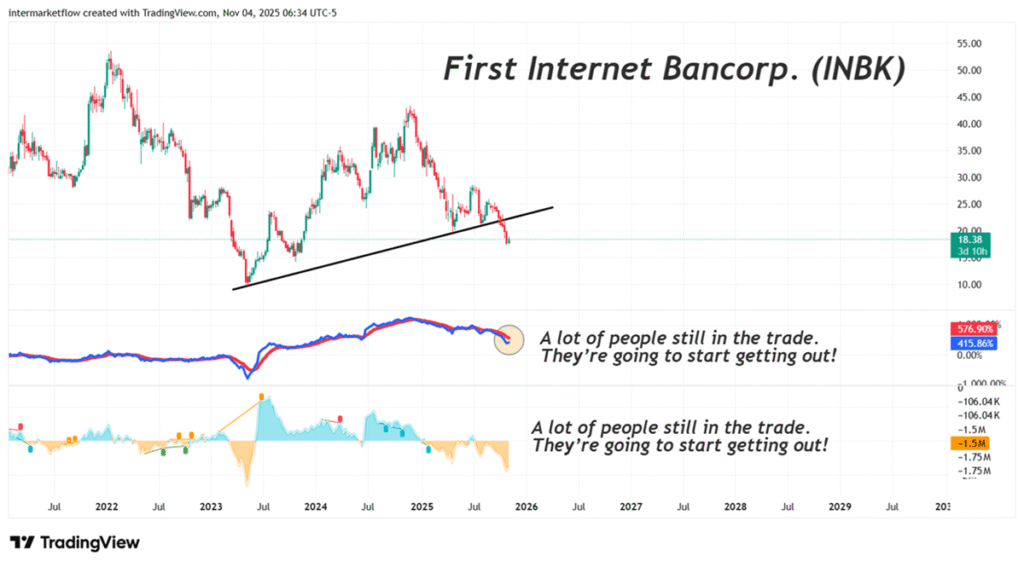
A purely technical analysis of the financial sector as a whole, with a focus on INBK and NWBI in particular.
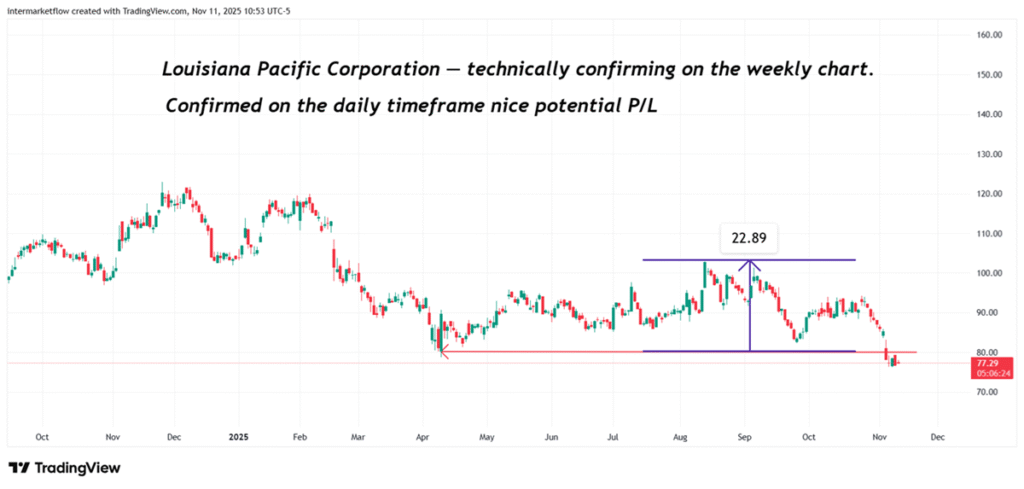
#74 Complete Technical Set Up for the Home Builders Sector-Nov 26
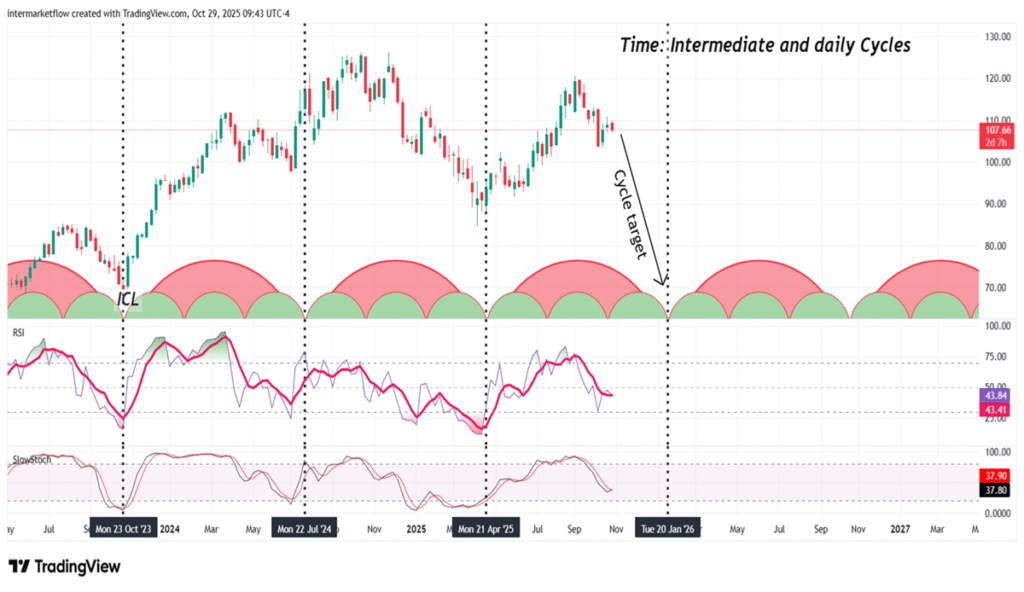
A complete technical analysis covering all branches of technical study: trend, time, volume, mean reversion, and charting.
#70 The Residential Market
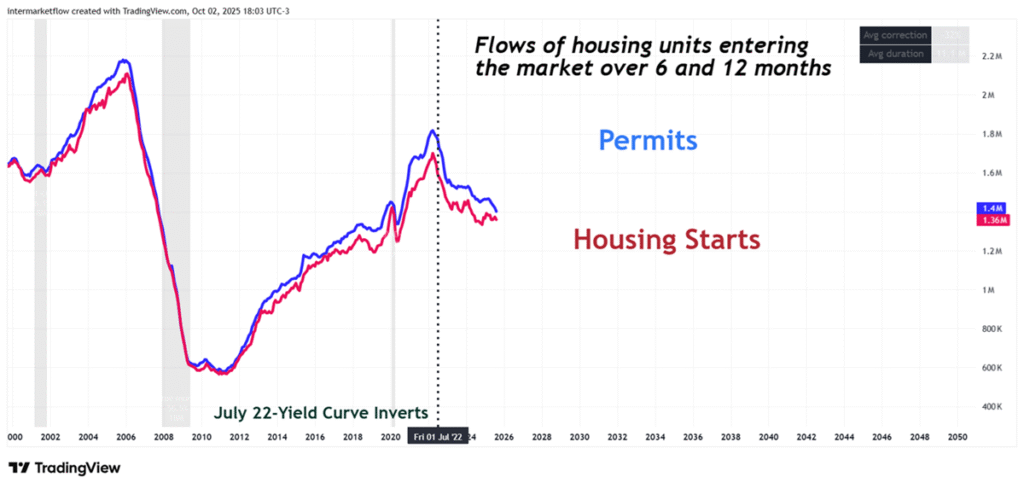
We seek to understand the relationship between the new and the existing home market—the different flows and inventories that shape both. We analyze how imbalances in one market affect the other.
#68 Spot federal rate spread vs. PCE inflation rate
We analyzed the intermarket capital flows that took place in the week of September 17, following the rate cut. We looked at the effects they generated, where they occurred, and with what volume. We searched and found where the volume moved that week.
#67 Labor Market and Consumption
The connection between consumption and the market may seem direct. It isn’t quite so since the state has also intervened in this market. Here we explain the market’s causalities. We break down Nonfarm Payroll to show why it fails as a true measure of employment, and finally, we lay out a concrete technical setup.
#66 Yen Carry Trade: What It Is, How It Works, and When It Blows Up
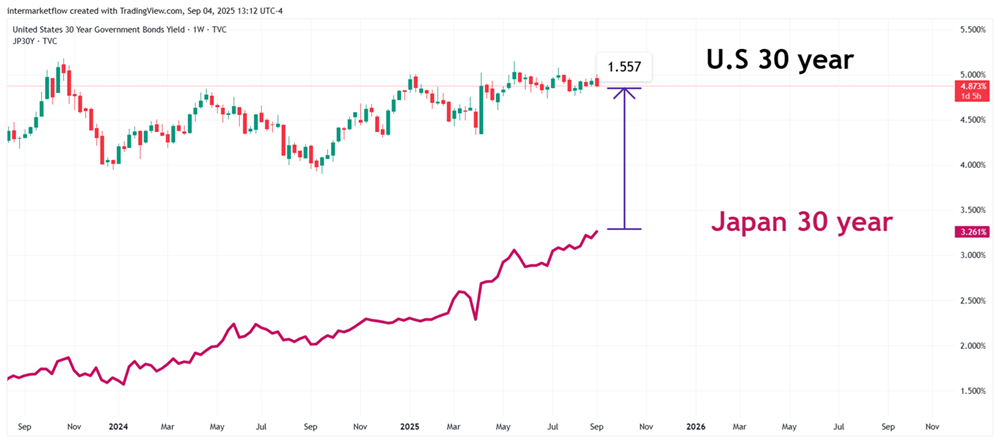
In this post we explain what the yen carry trade is. The different types, methodologies, and players involved. Which of them affect bond prices and which of them affect the exchange rate.
#62 A Deep Dive into the U.S. Credit Risk (Part 2): Delinquency and Loss Rates by Segment
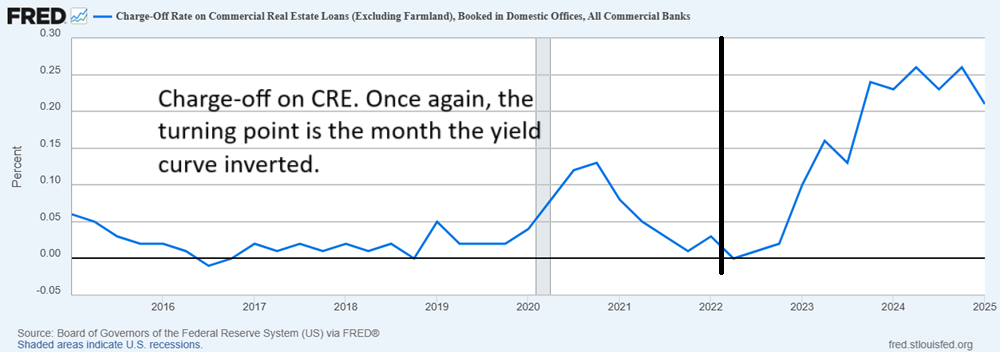
Completing our analysis of delinquencies and losses across different types of loans, we found that mortgage, CRE, small business, and agricultural loan delinquencies are all surging.
#61 Delinquencies rates on Consumer Credit: A Closer Look
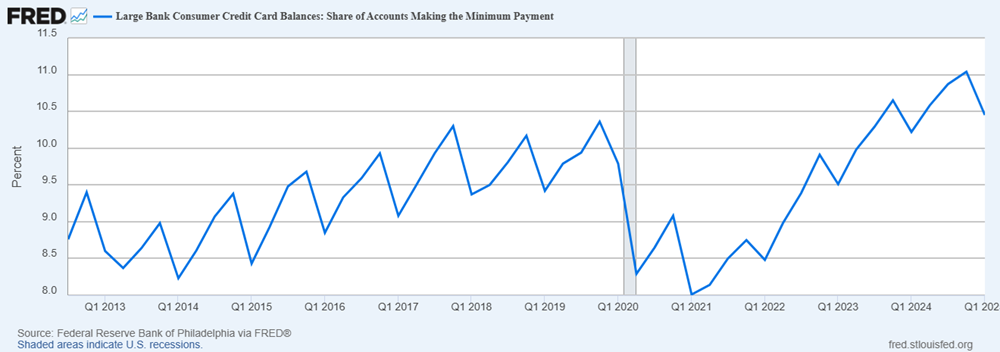
We conducted an in-depth analysis of the banking industry’s consumer loans and found that delinquency and loss rates are huge across all categories — 30, 60, and 90 days. On top of that, the percentage of people paying only the credit card minimum is surging. From there to becoming delinquent — how long is it? Two months?
#60 Understanding rate-Driving Markets dynamics
U.S. markets are facing high uncertainty. They’ve just gone through the deepest and longest yield curve inversion in history. With valuations stretched and prices at all-time highs, it’s time to open your mind and consider other options.