#65 Jackson Hole Reactions, Rate Cuts and the Intermarket
We analyze the intermarket moves that took place after the Jackson Hole conference. We seek to identify where capital flowed.
#64 Z-Score: A statistic every trader must understand
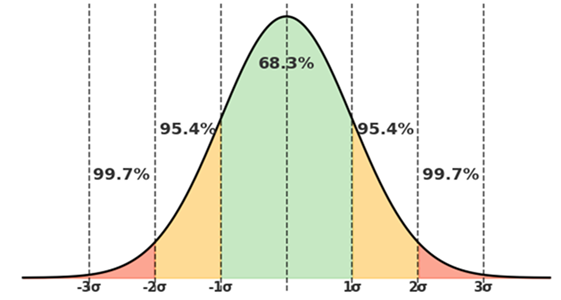
Intermarket Analysis Throught Macro and Technical Methods Here you will find: The concept of Z-score, clear and simple so that everyone can understand it.The theoretical mathematical foundation where it originates. We’re going to use this metric a lot in the services we’re launching. It’s important that you understand it so we can move […]
#66 Yen Carry Trade: What It Is, How It Works, and When It Blows Up
In this post we explain what the yen carry trade is. The different types, methodologies, and players involved. Which of them affect bond prices and which of them affect the exchange rate.
#62 A Deep Dive into the U.S. Credit Risk (Part 2): Delinquency and Loss Rates by Segment
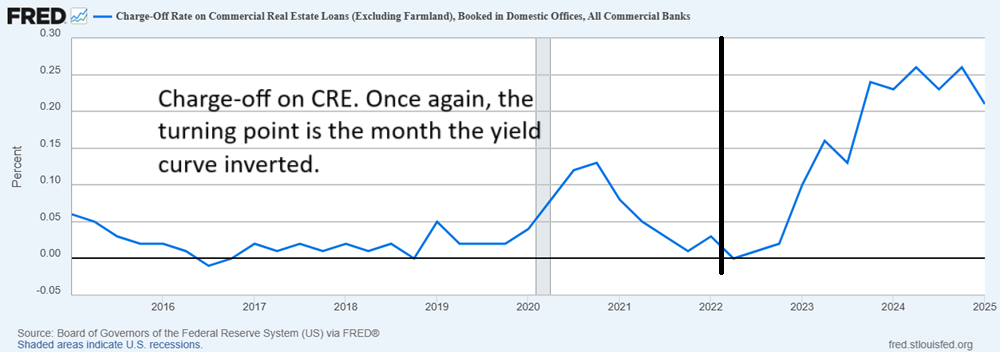
Completing our analysis of delinquencies and losses across different types of loans, we found that mortgage, CRE, small business, and agricultural loan delinquencies are all surging.
#61 Delinquencies rates on Consumer Credit: A Closer Look
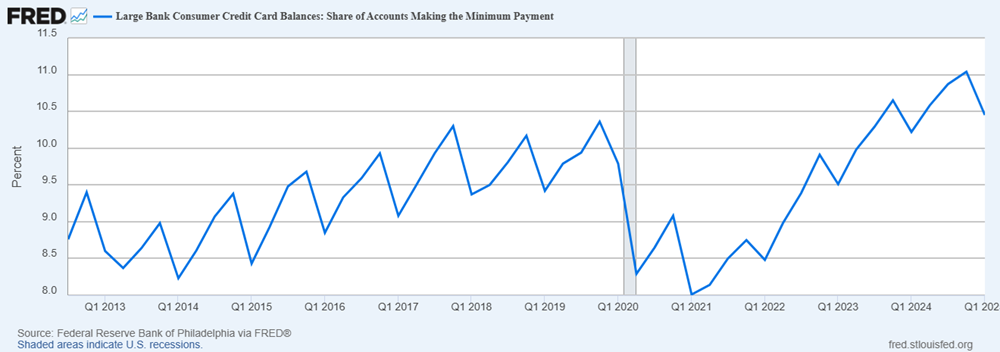
We conducted an in-depth analysis of the banking industry’s consumer loans and found that delinquency and loss rates are huge across all categories — 30, 60, and 90 days. On top of that, the percentage of people paying only the credit card minimum is surging. From there to becoming delinquent — how long is it? Two months?
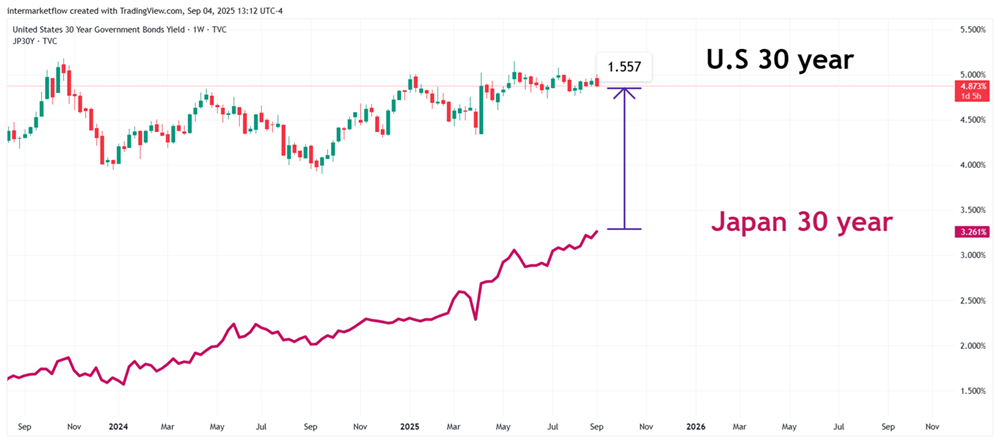
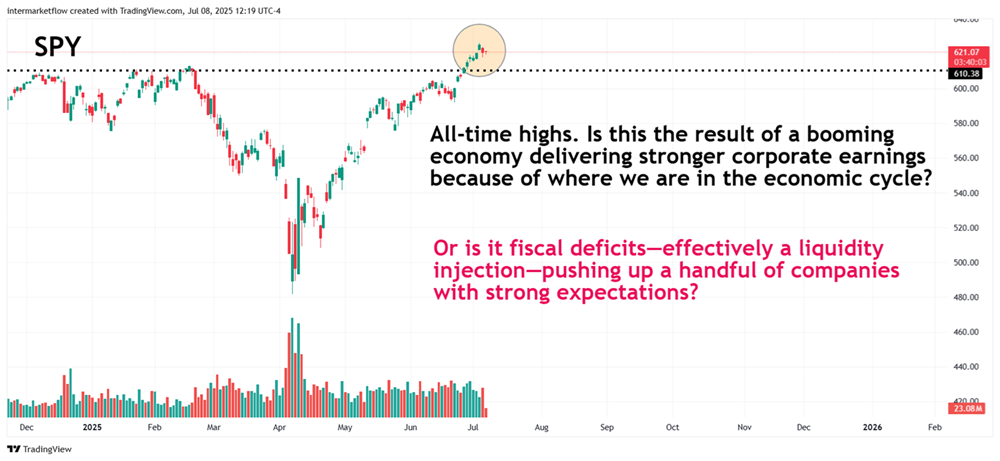
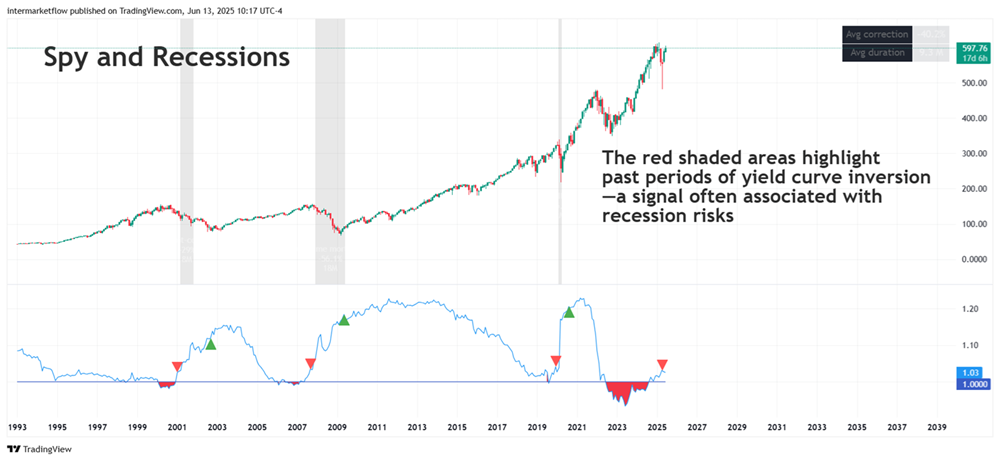
#60 Understanding rate-Driving Markets dynamics
U.S. markets are facing high uncertainty. They’ve just gone through the deepest and longest yield curve inversion in history. With valuations stretched and prices at all-time highs, it’s time to open your mind and consider other options.
#59 Macro reading of the S&P 500 and its sub-indices
Each sub-index of the S&P 500 reflects the situation of different types of companies.
When analyzing the S&P 500 from a macro perspective, it’s essential to go beyond the index level and dive into its underlying sectors. Each sub-index reflects different parts of the economy—cyclical, defensive, interest-rate sensitive, etc.—and reading their relative performance helps anticipate where capital is rotating, how macro expectations are evolving, and what stage of the cycle we’re likely in.
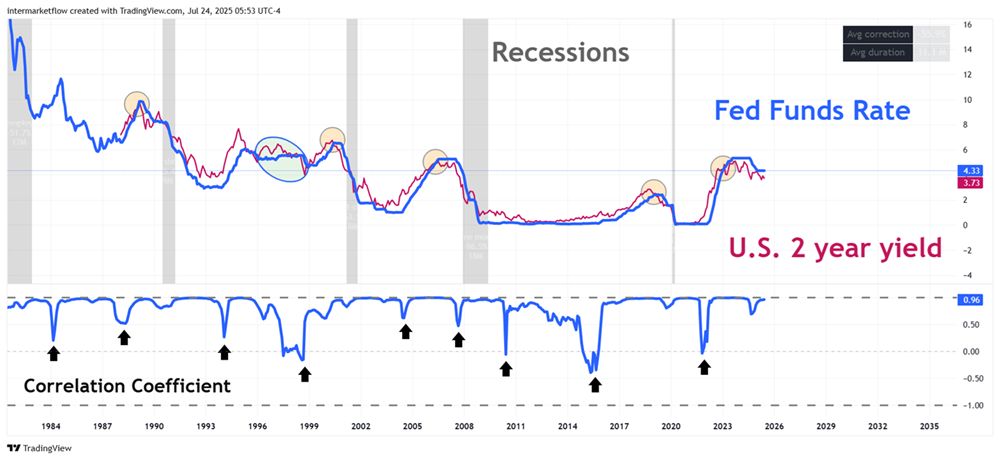
#58 Causality between the yield curve and leading indicators.
We covered two different interpretations of the yield curve: the inversion and the first Fed rate cut. We analyzed the last four recessions and measured the lead times to estimate the window until the next recession.
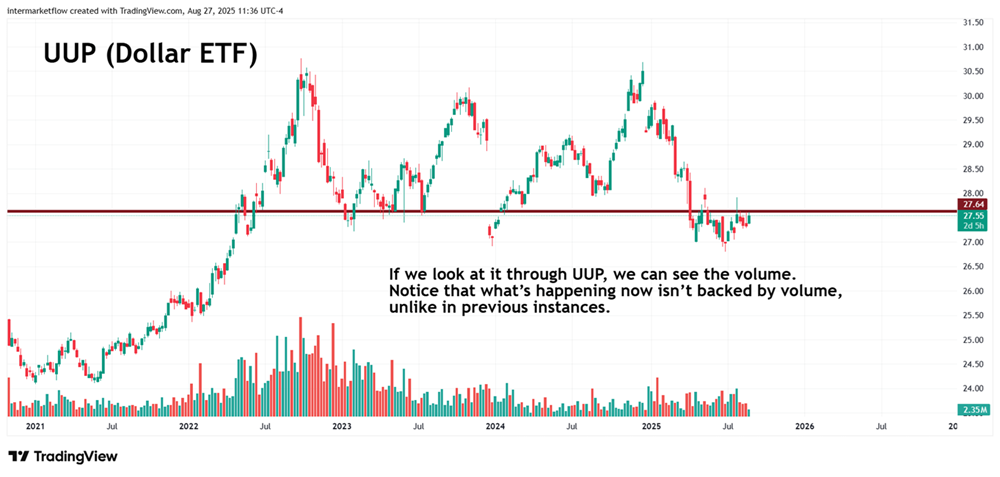
#57 A deep dive into the current state of the dollar
This article explores the U.S. dollar’s status as the world’s reserve currency—its role as a safe haven, as a reserve held by both private investors and central banks, and as the dominant currency in global trade.
#56 Global equities—time to open our minds. Trading has become a global game.
U.S. markets are facing high uncertainty. They’ve just gone through the deepest and longest yield curve inversion in history. With valuations stretched and prices at all-time highs, it’s time to open your mind and consider other options.