
A credit crisis hiding inside a bond crisis.
While the market debates medium- and long-term rates, credit stress is building, and the repricing remains incomplete.
Main conclusions of previous reports
- A credit crisis is hiding beneath a broad exit from bonds.
- The yield curve adjustment is incomplete. Major equity indexes have yet to fully reflect the latest shift in yields.
- Volatility is compressing, but not everywhere. The MOVE–VIX gap remains at its widest this year. Within equities, Russell 2000 volatility is rising against the broader compression.
- Intermarket transmission is underway. Credit pressure is visible in small caps, while utilities are carrying bond-market stress into equities.
- Macro flows point toward contraction. Capital continues to favor assets associated with contraction in the real economy.
- The Hands-Out regime persists.
Course of action
- Cash or an outright bearish bias, focused on small caps, high-beta stocks, and credit-sensitive sectors.
Invalidation is defined in advance
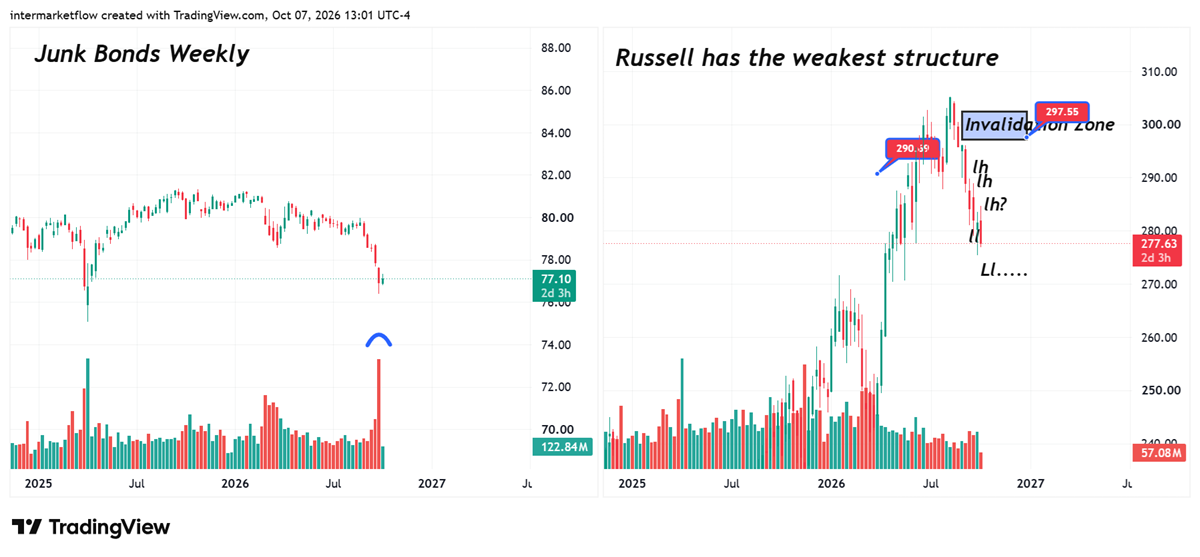
- We use the Russell 2000 as the main barometer of this thesis, alongside high-yield bonds and rate-sensitive sectors, to track confirmation, transmission, and invalidation.
Risk Regime
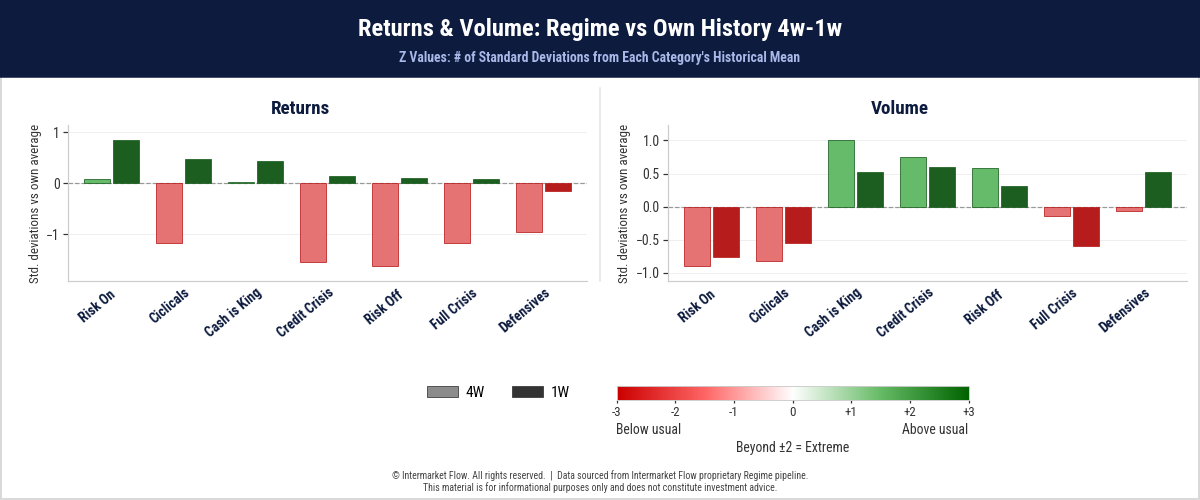
Risk Perspective
- A renewed divergence between returns and volume.
- Risk-On: despite differences across profiles, returns and volume are rising, but volume remains below average.
- Risk-Off: returns and volume are rising, both above their historical averages.
Asset Perspective
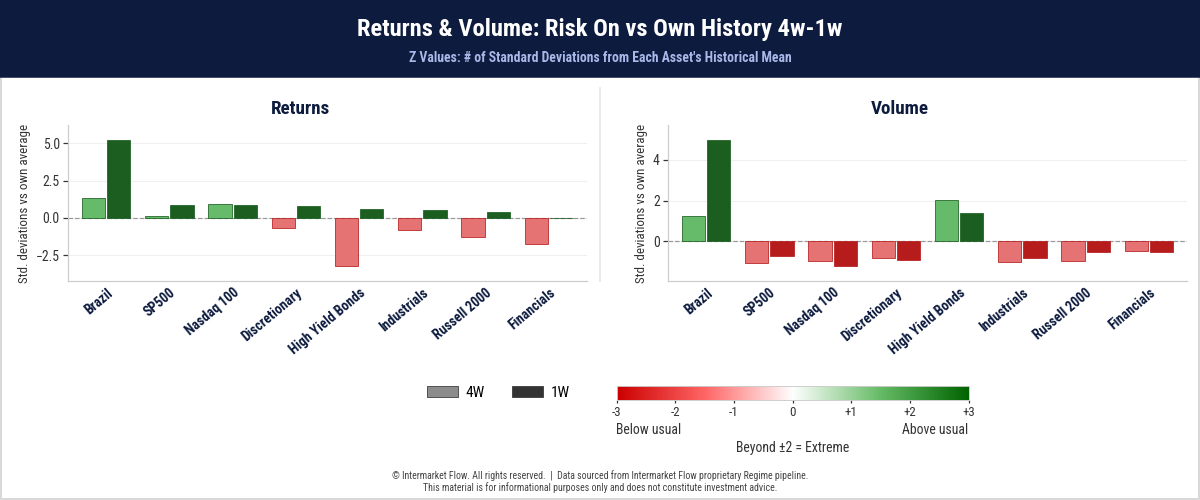
Breaking down Risk-On assets
- Capital moved toward Brazil following the election result.
- The remaining assets show below-average dollar volume, with volatility at or near statistical extremes.
Macro Regime
From a macro perspective, flows remain directed toward assets associated with contraction in the real economy.
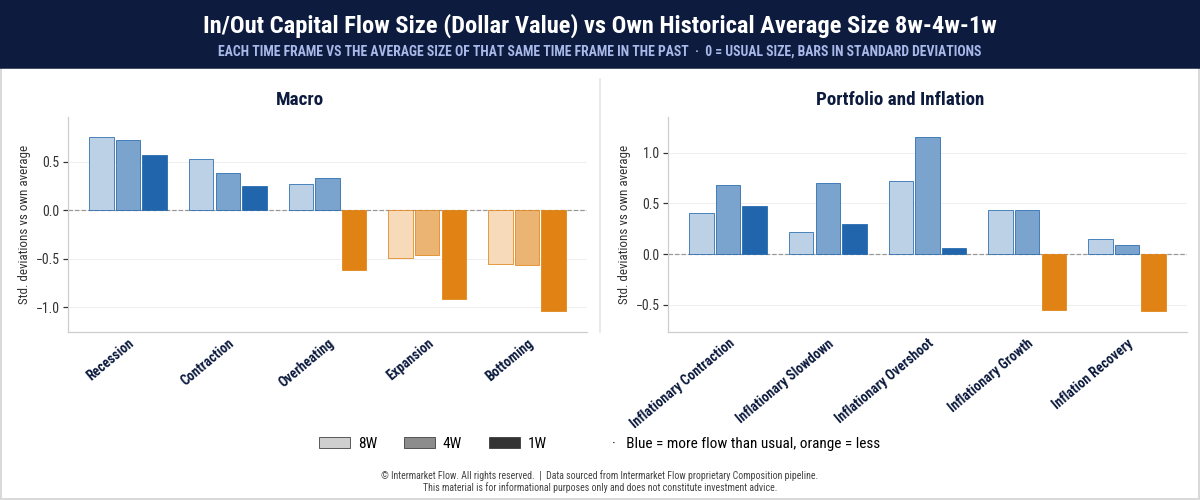
The same pattern extends across economic sectors. To varying degrees, all are adjusting to the new macro narrative taking shape in the market.
Weekly Charts
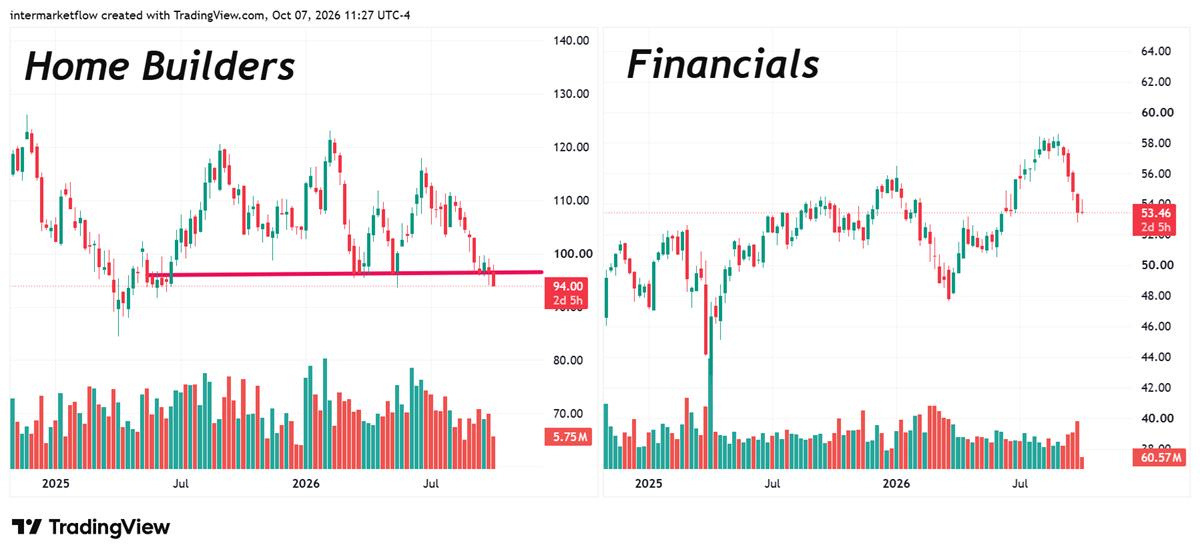
- Housing—shaped by the Fed’s intervention through MBS purchases—also signals a slowdown in the real economy, likely reflecting expectations of weaker activity ahead.
- We have been tracking financials for several reports, and the weekly technical structure increasingly favors the short side.
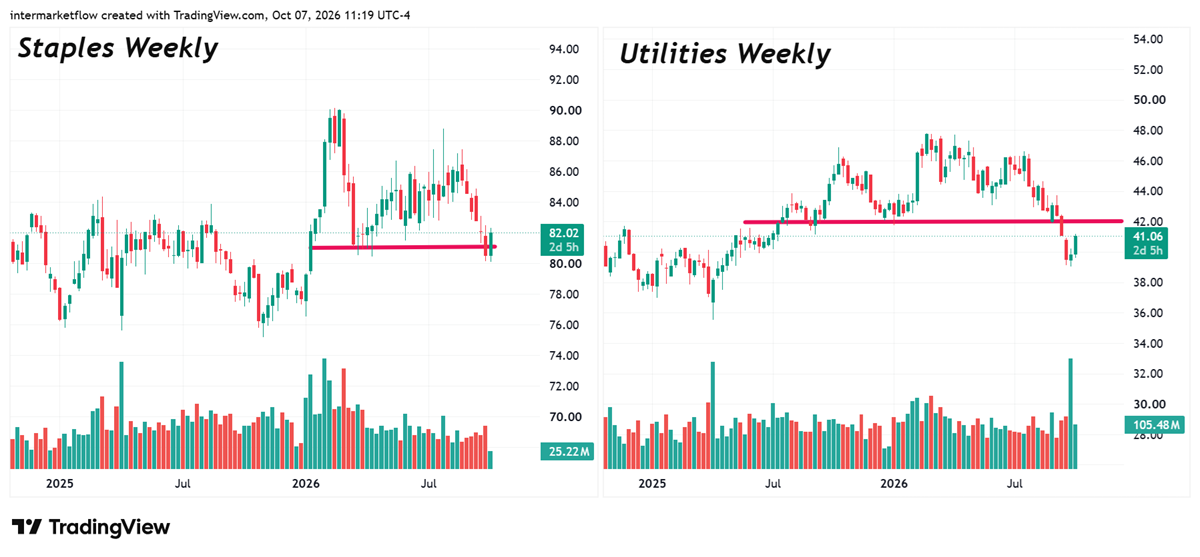
- Defensive sectors offer no shelter. There is no rotation.
- Utilities present a sell-the-bounce setup.
Volatility Regime
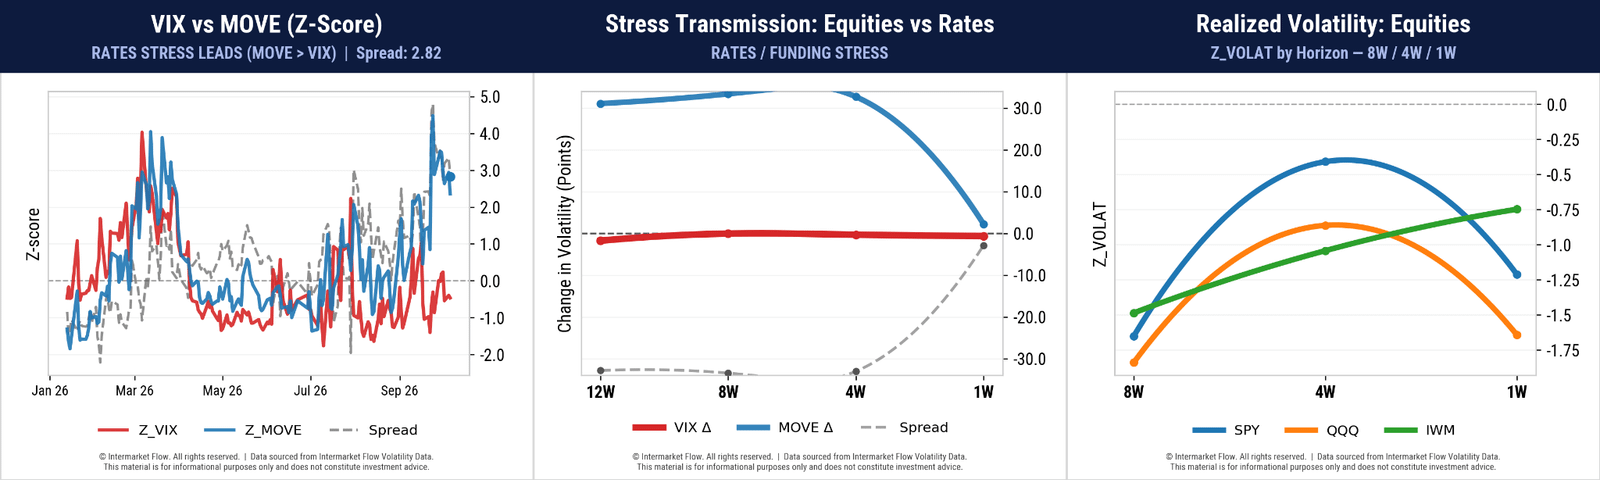
- The volatility gap between bonds and equities remains at its widest this year (left chart).
- The rate of change in volatility is converging toward zero in both asset classes. Equity volatility remains stagnant, while changes in bond volatility have faded.
- Rate of Change are not levels: the levels gap in realized volatility remains statistically extreme.
- Within equities, volatility is compressing across the board except in the Russell 2000, where it continues to rise.
- This adds another sign of weakness in small caps.
Main Conclusions
- No major changes in the risk or macro regimes.
- Volatility dynamics are stabilizing, but the extreme gap in levels persists.
- Rising small-cap volatility relative to other indexes adds another signal of intermarket transmission.
Markets
- The adjustment continues to unfold outside the major indexes.
- Our vehicles, invalidation zones, and targets remain unchanged.
- Technical signals are beginning to align across sectors.
- Rate-sensitive sectors provide technical confirmation.
Our reporting frequency means some findings repeat, but each update reveals movement in new pieces of the puzzle.
The major indexes are forming a potential top. Identifying that top—or confirming the correction—provides the timing to act.
Intermarket Flow
OR
UPGRADE
Free trial has expired.
If you believe this is an error, please contact the administrator.
If you believe this is an error, please contact the administrator.
OR
UPGRADE