Last week we saw that there’s one variable that can truly destabilize markets: uncertainty. Here
You can’t touch it or see it—but you can feel it. And even though it’s intangible, the market expresses it in many ways, across different assets.
Uncertainty can encompass everything—when the whole system trembles—or focus on a single category. It takes different forms, and markets react differently depending on how they perceive it.
Cross-asset uncertainty and Yields
We’re going to look at four ways the market expresses uncertainty—and why this time we’re facing equity valuation uncertainty, at least for now.
Fed Funds and 3 month yield correlation
We saw this a long time ago somewhere in the blog.

Fed Funds and 2 year yield correlation
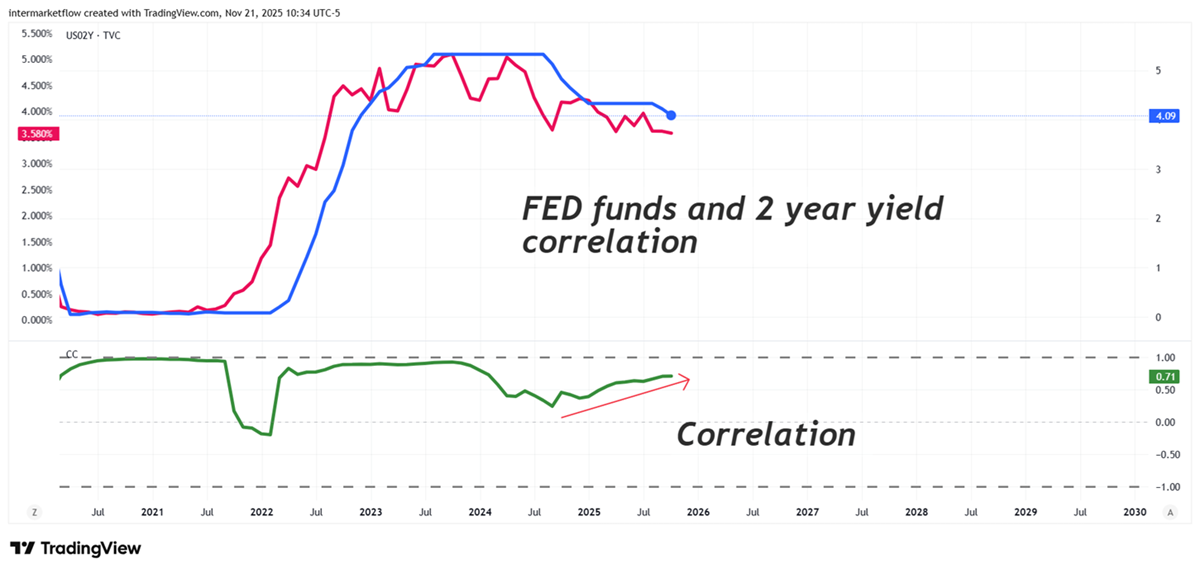
When the correlation rises, it means the market and the Fed are becoming more aligned.When it falls, the market starts clashing with the Fed — and that’s when volatility tends to spike. If this were a systemic or broader global crisis, this would be the first place we’d see it.
Cross-asset uncertainty and Equities

A rising VIX reflects that the market feels less certain about the near future, and investors prefer to pay for protection rather than hold net exposure.It’s important to note that this sentiment is relative to stock prices.
Cross-asset uncertainty and Bonds

Bond market volatility keeps falling — nothing’s happening here.
Cross-asset uncertainty: Credit Risk?

Intermarket: Cross-asset uncertainty, Oil and Gold


Gold volatility remains at normal levels, even though on the 25th we have the month’s largest option expirations and seasonal physical deliveries.It should be moving more — the calm feels unusual.
We’re looking at an equity market stepping into a phase of higher volatility.
We saw it coming in the previous chapter, so it shouldn’t surprise anyone. Equities are clearly out of sync — at least on the surface — with what’s happening in the real economy.
Sharp swings like Thursday’s correction signal that something’s shifting beneath the surface. Even if the market rebounds —and we’ll be watching the strength and volume of that move— the message doesn’t change: something’s in motion. We saw this here
Other assets —bonds, credit, gold— aren’t showing the same tension. That means the issue lies in risk pricing, not in liquidity or solvency.
Equities are going through an adjustment in expectations, not a loss of confidence. And when that happens, volatility looks violent —because the market can’t decide whether it’s multiples, earnings, or both that need to reprice.
Cross-asset uncertainty: Lets trade this thing!
If you’ve been following along, last Wednesday we talked about the different profiles we can look for within the equity market and went over a few examples. Here
If you think about it, what we just did here is the step before that — a broader, more comprehensive layer of analysis known as Intermarket Analysis.
It’s the framework that connects everything: how capital flows between asset classes, where the stress starts, and how, in this case, ends up reflected in equities.
At the end of the day, capital flows in financial markets have a finite number of destinations: Bonds, equities, currencies, and commodities — all of them connected through interest rates.
If this is about valuations, then where are the opportunities? It’s time for numbers and technical analysis
You can’t take advantage of this without understanding Z-scores and how they represent standard deviation. Z-Scores Here
Returns by Company Type
When there’s a shift in perceived risk — whatever the reason — everything falls.
No type of company is spared, because at that moment the market isn’t analyzing fundamentals; it’s questioning value itself.
Essentially, it’s asking: “Does this really deserve to be priced where it is?”

Just watch weekly returns and after that volume. Z’s in volume show you how big this really is.
Bonds Returns
I just wanted to show you this. Bonds returns, volume and z’s. A different story

Looking for vehicles to express my hypothesis
Big Banks
These haven’t been corrected at all. We already know — because we saw it here — that their balance sheets are messy. That’s potential!
It’s not something that’s been in the media — maybe a few rumors here and there, but nothing major.

Fast Food
They’ve already been hit. There’s blood — but I think there could still be more to come.

As the Z-scores show, not much happened this week — yet Thursday was a violent one.
These are the companies whose technical analysis will be sent on Wednesday. At least you’ve got something to look at in the week end.
Footnotes

SPY — that’s the chart to watch.
Price and volume tell the story. For now, it looks like a bull trap.

You already know. I’m not making recommendations — I share my work for marketing purposes.
See you next time, God willing.
Martin
If you believe this is an error, please contact the administrator.
One Response