Intermarket Analysis Throught Macro and Technical Methods
Intermarket Analysis Essentials for Proficient Traders
Understanding the Relationship Between Interest Rates and Asset Categories
A simple way to illustrate this is to imagine the flow of global speculative capital as the journey of a train. Unlike real trains, this one has no set departure or arrival times, but it does have a number of established and finite stops.The order of the stops, the duration of time at each stop, its current location, and the next stop are determined by known factors and the future expectations of those same factors. Various macroeconomic variables interact with each other. However, all are directly or indirectly influenced by nominal interest rates. In some, the effect is direct, simple, clear, and has established or quasi-established lags. In others, the effect is different, not so direct, and with more variable time lags.
Introduction to Intermarket Analysis
Let’s start with the macroeconomic identity:
Nominal = real rates + inflation + Term Premium
The term premium is the compensation that investors require for bearing the risk that short-term Treasury yields do not evolve as they expected. In the upcoming articles, we will analyze this component in depth.
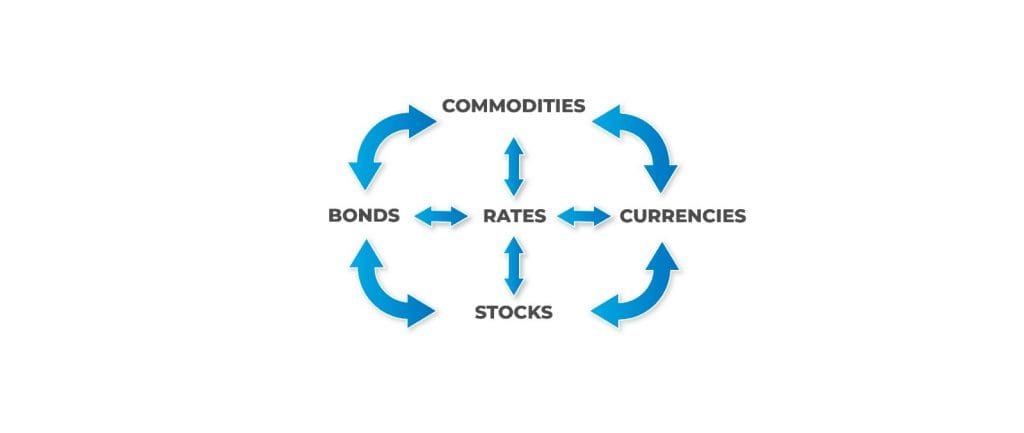
A fundamental axis that connects all variables
The mother of intermarket relationships is established between the bond market and commodities.These asset classes are highly correlated between them. A professional portfolio Manager knows this. A professional trader usually don t
Why?
The price of commodities, such as oil, copper, aluminum, wheat, etc., directly influences inflation expectations. As we have seen, inflation expectations, in turn, directly affect nominal interest rates. These affect nominal rates, triggering a chain of events that moves from market to market. It’s a butterfly effect. Let’s look at some charts to illustrate the point.
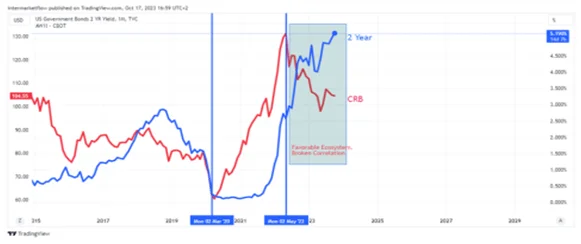
CRB Index vs 2-Year Rate
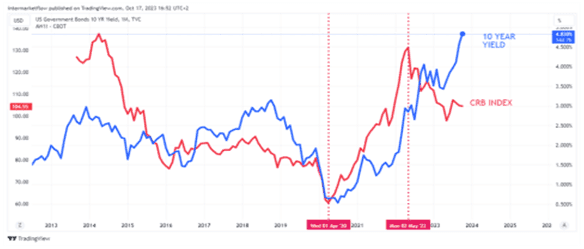
CRB Index vs 10-Year Rates
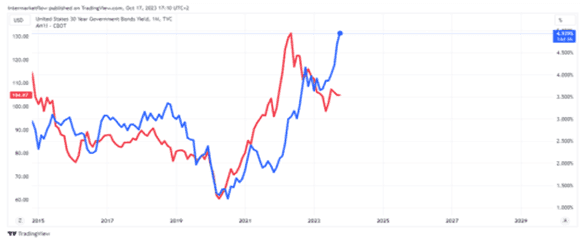
CRB Index vs 30-Year Rates
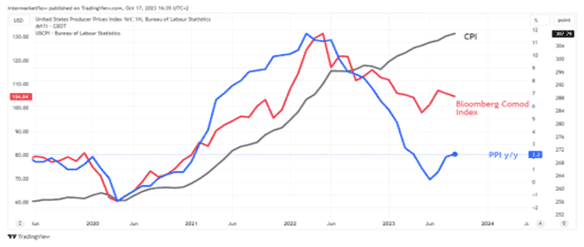
CRB Index vs P.P.I vs C.P.I
Futures prices as leading indicators
The most important aspect of this indicator is that it uses futures prices up to 9 months in the future, to be redundant. Notice the difference vs the C.P.I or the P.P.I, which use data generated the previous month. That is, they are what economists call lagging indicators. This is a radical difference.
Lags
In terms of lags, the CRB leads the P.P.I by an average of 7 months in its annual version. The C.P.I in its annual version by 8 months. It is estimated that a 10% movement in the CRB index translates into a 1% movement in the annual C.P.I 8 months later.
Correlations
Regarding the correlations between these variables, CRB index vs P.P.I is 71% and vs C.P.I is 68%, both in annual version. These correlations, like all in the financial world, vary. They are not constant but in this case, we can identify the situations that increase or decrease them. Let´see.
Yield Curve influence
Nominal interest rates are lead, for all the reasons mentioned above, by the CRB index. It has an 80% relationship with the 10-year rate and an even higher percentage with the 30-year rate.
In short
Therefore, as can be seen in the charts, the CRB Index is a very clear leading indicator of inflationary pressures and therefore clearly anticipates the entire structure of the Yield Curve. In addition, both the C.P.I and the P.P.I are lagging indicators on a monthly and annual basis (data is taken a month after the fact), while the CRB Index trades in real-time and on expectations 9 months ahead. Depending on the part of the economic cycle we are in, the strength of demand, and the ability to pass those increases onto prices, they are first reflected in the Producer Price Index (P.P.I) and then in the Consumer Price Index (C.P.I).
The key
The speed of these price transfers is another challenge for the intermarket analyst. Trading strategies should take into account this facts and include them in their trading strategies. To delve deeper into intermarket analysis, it is essential to understand everything related to interest rates.
The Journey Ahead
This journey starts from scratch. We aim to include as many “travelers” as possible, so we will go to the basics of the subject.
Just from this report, endless questions arise:
- Where do interest rates come from?
- What affects them, especially the real ones?
- Where are the different term interest rates generated?
- How is a yield curve formed?
- How do you read a yield curve?
- What effects do these curves have on companies and consumers?
- How to estimate inflation expectations? What influences them?
- What are the sensitivities of each asset to interest rates?
- How many interest rates are there?
- Why does this affect the behavior of consumers and corporations?
- What is and what affects the term premium?
The questions can literally be endless. Within our capabilities, we will try to clear up each of these topics one by one.
All of this must be clear, as it is the cornerstone of intermarket analysis and asset correlations.
Bonds and Intermarket
Bond traders have a saying:
“Understand the rates, or the rates will understand you”
After trading for almost 30 years, I take the liberty of adding to this wise popular saying
“Understand the rates and your asset’s sensitivity to rates, or the rates and the asset will understand you, and you’ll end up on a stretcher”
Equity capital, like all market agents, behaves rationally. The interesting part is realizing that capital never disappears. It can change owners, pause at a temporary stop, or flow to the next one, but it’s always lying in wait. Lurking.
Methology
The Intermarket Analyst reverses the focus of analysis. Firstly, instead of looking at a potential asset, they analyze all asset categories. They seek to detect the most likely next stop. Only after achieving this, do they delve into the search for the best asset.
There are four fundamental stops
Within each of them, there’s an endless number of asset-vehicles to express our hypothesis.
- Commodities.
- Bonds (yields).
- Stocks.
- Currencies.
Our working methodology is clear:
Read the messages that arise from intermarket analysis.
Next Stop
Understand at which stop the capital is located. This diagnosis is crucial because we will consider it the “ejector center.” It implies an exhaustive analysis of all markets.
Identify the most likely next stop based on technical analysis, the current macroeconomic narratives, our own macro narrative, and our diagnosis of where we are in the economic cycle.
Identify the asset or group of assets that fits our analysis, time horizon, and risk tolerance.
Vehicle
Choose the investment vehicle (stocks, ETFs, bonds, currency, futures, options, etc.) that best expresses our hypothesis, mainly based on technical analysis.
Our type of operations is based on a weekly time frame in line with the monthly, with signals generated on the daily framework. These operations last a minimum of between 2 and 6 months, so it’s crucial to know the volatilities of each asset to adjust the stop-losses and targets.
Our Tools
- Commodity indices, preferably futures indices.
- We will analyze the rates across the entire yield curve structure.
- We will use both futures contracts and spot rates as appropriate.
- Stock indices from various countries, market types, market capitalizations, and geographical locations.
- To analyze currencies, we will rely on several indices, mainly the Dollar Index, but we will also consider other currency indices.
In all cases, we seek to use futures that match the time horizon of our operations.
This journey, as the Chinese say, is 10,000 miles long. This article is the first step. The topic is broad, and along the way, learning and operations go hand in hand. There is no one without the other.
Where to find us
If you enjoyed our work, you can find us on X @intermarketflow or on our, website intermarketflow.com
You can subscribe or share it. It will cost you absolutely nothing and will truly make our day!
It means a lot to us.
Martin
Intermarketflow.com
- Intermarketflow
Intermarket Analysis LLC
703 Waterford Way - Suite 805 - Miami, Fl 33126
Unlock Full Access
We create professional content for traders, based on intermarket, macro, technical, quant, and flow analysis.
Welcome aboard — enjoy the ride.
If you have already registered before, please enter your email again to recover your session.
I found myself deeply moved by this piece. It’s rare to come across writing that doesn’t just inform but transforms. You’ve taken complex ideas and made them feel not just understandable but important. Reading this, I felt both challenged and comforted — a true testament to the power of your words.
You’ve written something that feels not just like knowledge, but like a quiet form of wisdom.