
Mid-Week Report
A review of what unfolded during the latest trading sessions and the defining characteristics of the market moves.Weekly Market Movements: Categories & Assets
Returns and volume are measured in Z-scores across monthly and weekly timeframes. The current focus is on these two periods, with the monthly timeframe represented by the first bar and the weekly timeframe by the second bar within each category.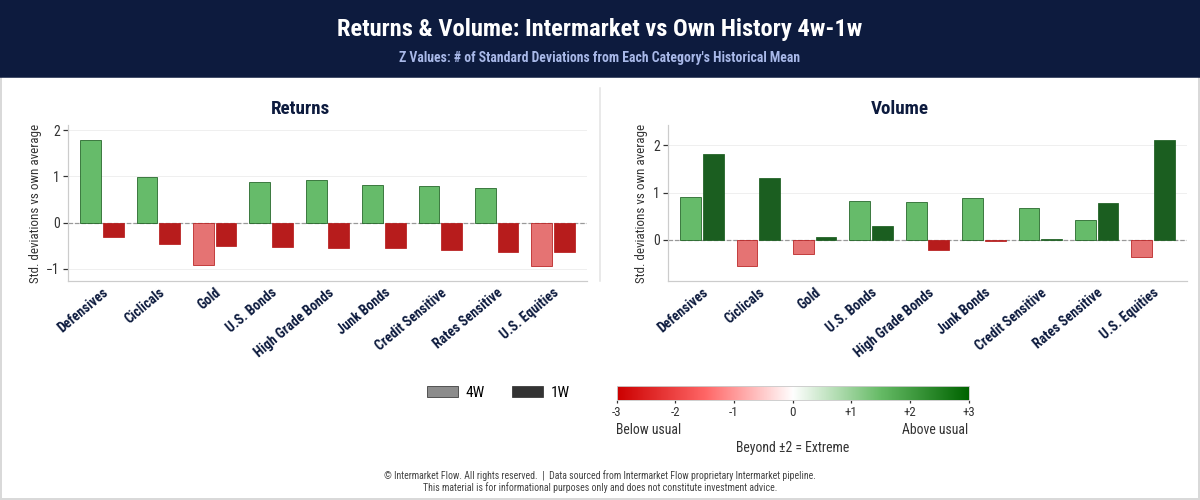
- Over the past week, returns have been slightly negative across the board.
- The key is understanding the conditions under which these returns were generated.
- The second chart provides that context: volume is concentrated primarily in Equities, followed by Defensives and Cyclicals, in that order.
- A battle is unfolding across these assets, with statistically extreme volume across Equities as a whole.
- So far, the outcome has been statistically small but negative. In other words, shorts are narrowly ahead on a weekly basis.
- Another relevant development is the sharp increase in volume over the past week, in a market we already know to be extremely thin, as we have repeatedly highlighted in our recent reports.
- These are ideal conditions for extended market moves. We flagged this possibility as likely, precisely because of how thin market liquidity was.
The Market Through Ratios
The chart illustrates current weekly valuations within the prevailing monthly timeframe, mapping relative capital flows across both timeframes.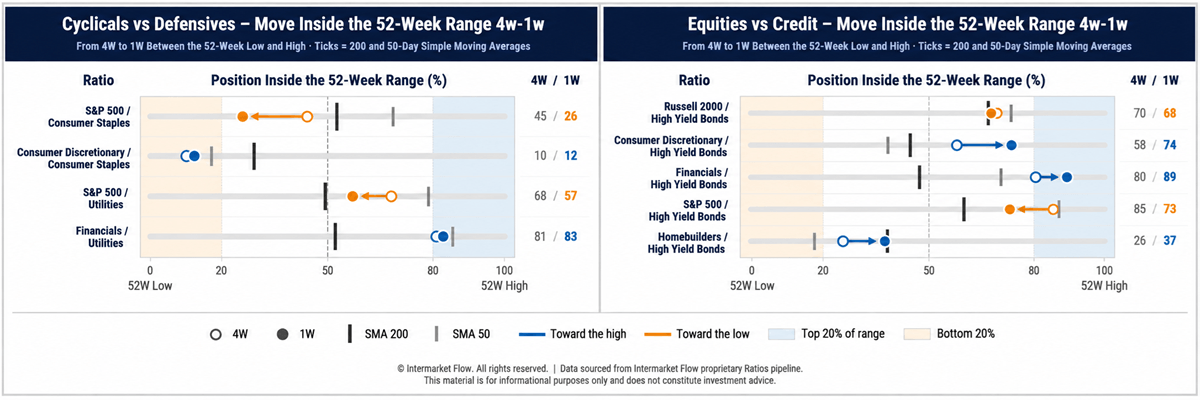
- Staples has already generated a death cross against Discretionary stocks.
- If the current trend persists, the S&P 500 is not far from triggering the same technical signal.
- The second chart examines relative valuations against what we consider one of the weakest asset classes: High Yield Bonds.
- The Russell 2000, our current measure of risk, which we have highlighted repeatedly in previous reports, is now sitting at its 200-day moving average.
- Technically, this is a highly relevant level for the simple reason that it represents a key reference point closely monitored by market participants.
Past, Current & Forward Volatility Expectations
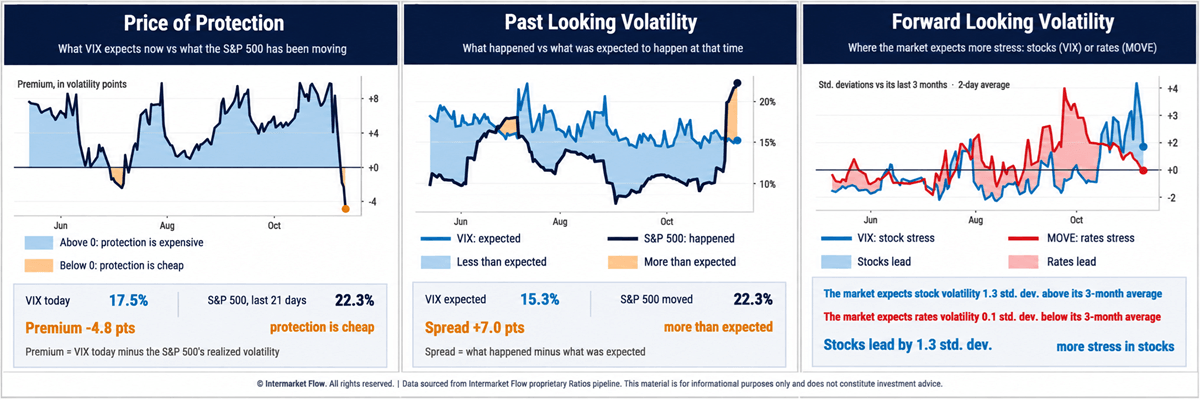
- The first chart shows that implied volatility is trading at a discount to realized volatility. In other words, the market is pricing volatility exposure relatively cheaply compared with the actual price movements being observed, making this an opportunity to take advantage of this relative mispricing.
- For the first time in a long while, realized volatility has exceeded implied volatility in a market that had been systematically overpricing protection.
- Finally, forward-looking volatility expectations for the next 20 days are declining across both bonds and equities, although equity volatility remains at relatively significant levels.
Selected Intermarket Channels: Connections & Disconnections
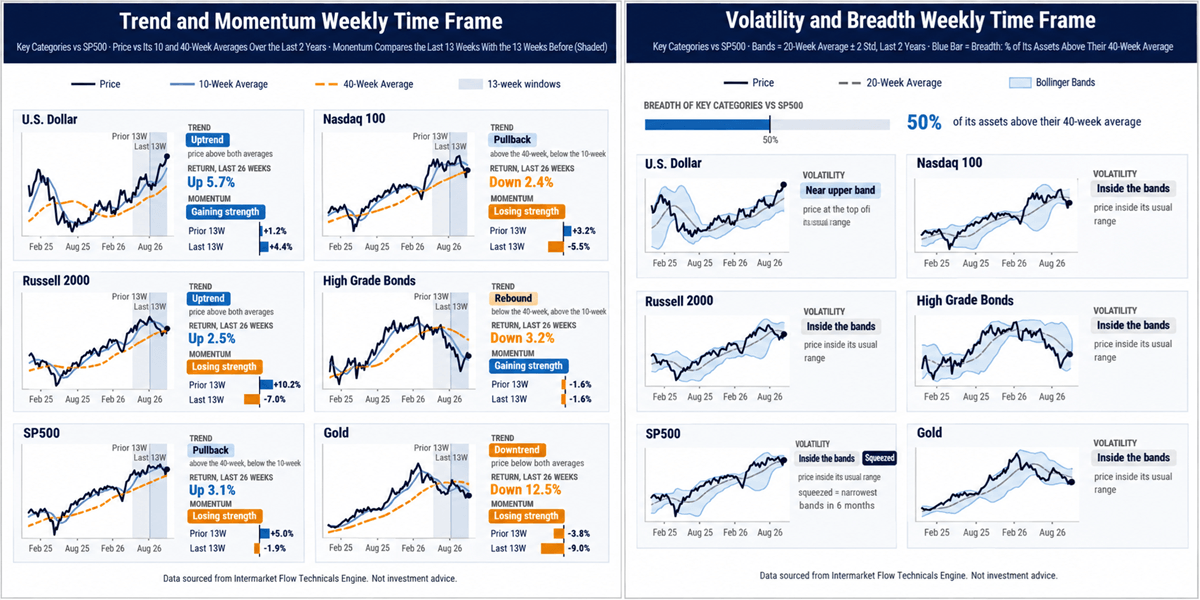
- There is coherence between the strength of the U.S. Dollar and the weakness of Gold.
- Across the equity spectrum, there is also coherence, with all major segments at critical levels, trading at, near, or below their 200-day moving averages.
- The point of divergence emerges in the weakness of High Grade Bonds.
- Most of these bonds are issued by companies within the S&P 500 and Nasdaq, yet their technical positioning is inconsistent with that of the companies issuing them.
- Their debt is worth less, but their equity prices are not reflecting the same weakness.
Daily Timeframe — Trading System
Selected charts on the daily timeframe, analyzed through our proprietary trading system.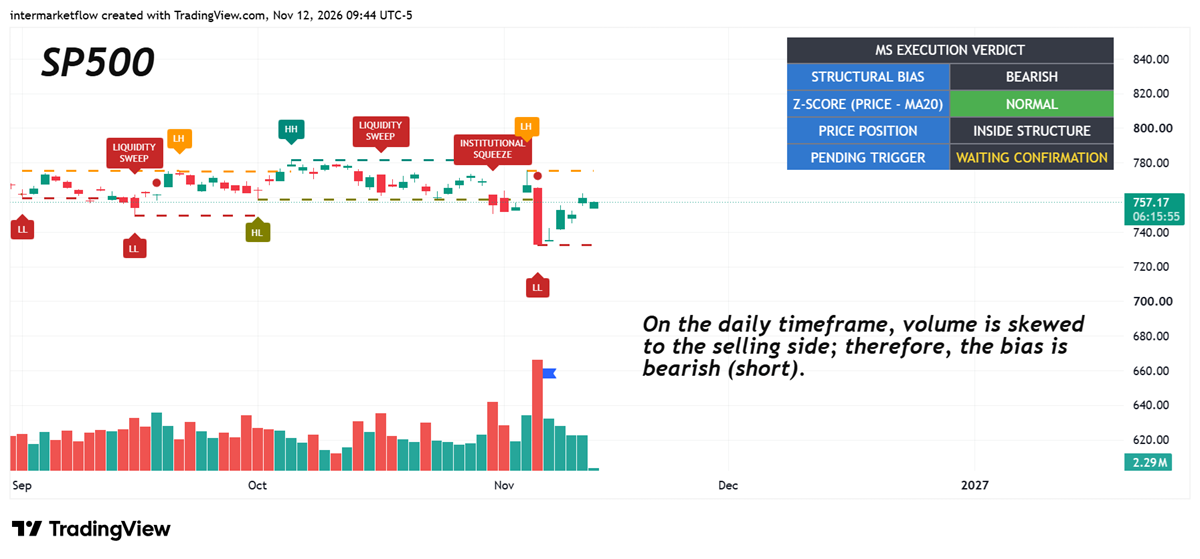
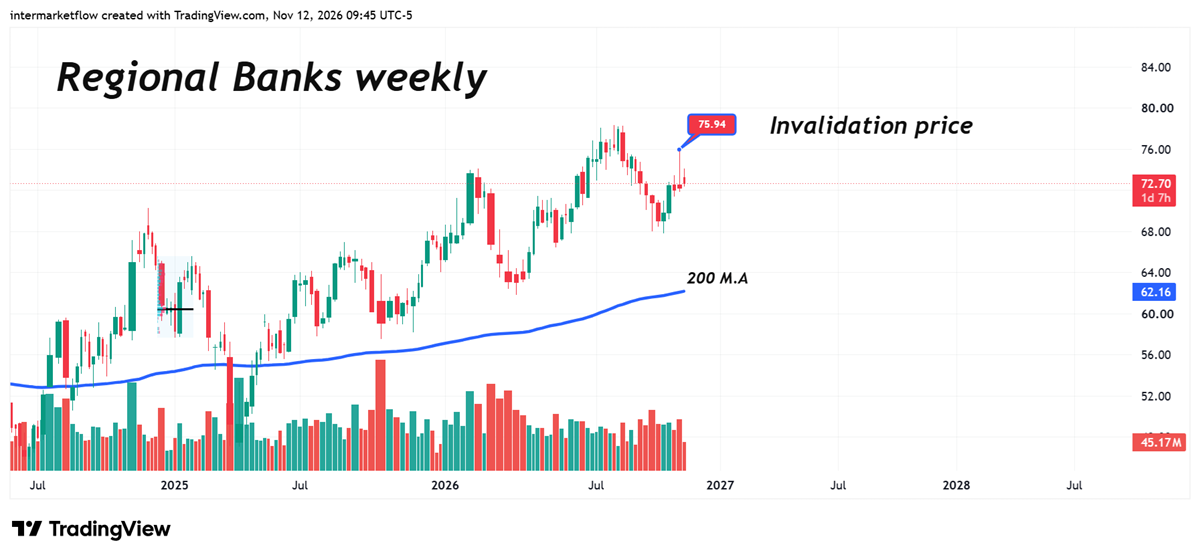
- High Grade is already showing weakness, but Junk is in an even worse position.
- Meanwhile, interest rate futures markets are pricing in a 95% probability of a rate hike at the December 9 meeting.
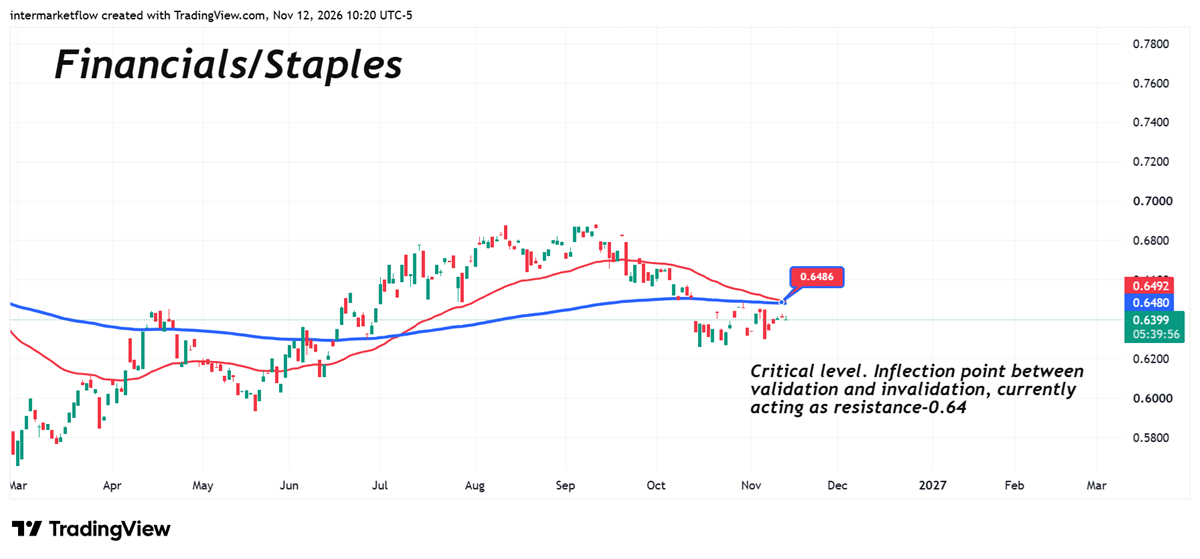
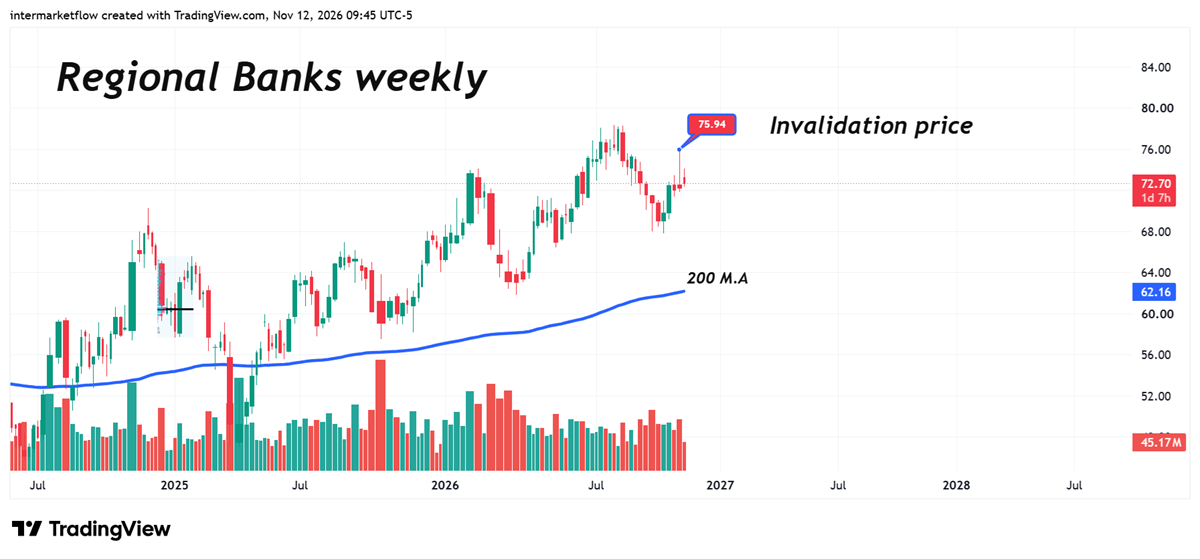
- Yet, relative valuations across different classes of financial assets continue to signal strength, contradicting virtually everything else across the market.
Course of Action
- The opportunity lies in the pricing of hedges.
- The signal lies in intermarket divergences, particularly the lack of alignment between Financials and the rest of the market.
Intermarket Flow
OR
UPGRADE
Free trial has expired.
If you believe this is an error, please contact the administrator.
If you believe this is an error, please contact the administrator.
OR
UPGRADE