Current state of things: With each report, more links between the bond market and equities have emerged.
First, a credit crisis took shape within the broader bond-market selloff.
High yield came under pressure and remains under pressure.
The link to Utilities then emerged, followed by the move in Homebuilders, the most rate-sensitive sector.
Weakness has also been evident in Small Caps, with a focus on rate-sensitive sectors.
These are the vehicles we have been highlighting in past reports (here)
The next step is to examine how this sequence appears across capital flows, participation, relative valuations and sector technicals.
Credit Stress and Capital Flows Across Market Regimes
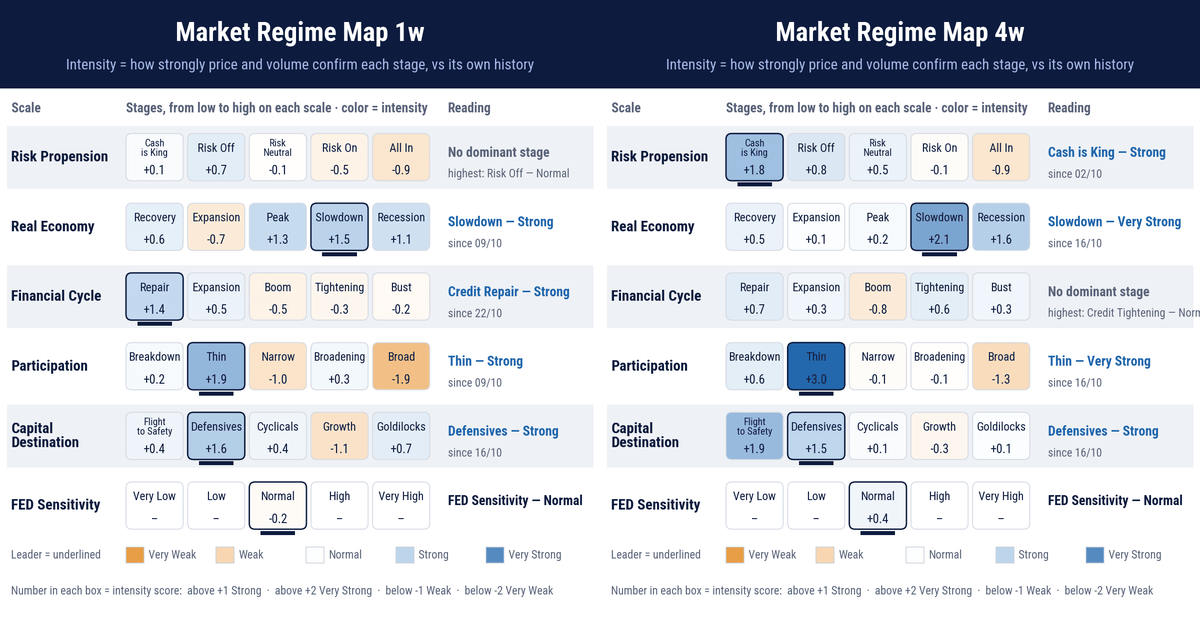
Evolution from 4W to 1W Across Different PerspectivesA summary of capital flows across two timeframes: monthly on the right, weekly on the left. Each row represents a different perspective.. This is a consolidated summary of what we have been analyzing for weeks.
Market Regime from a Risk Perspective
The dominant regime is Cash Is King. What stands out, in the monthly time frame, is the degree of convergence between prices and volume, with a z-score of 1.8—almost two standard deviations above its historical mean.
A really strong statistical confirmation of the regime’s present situation.
Moving to the right across the spectrum on the monthly table, we see the progressively stronger risk aversion that dominated the period.
A pause in this risk propension appears when we shift focus on to the weekly time frame. A thing to watch.
Market Regime From Macro-Cycle Perspective
Both monthly and weekly capital flows are directed toward assets associated with a slowing economy, with high readings for assets associated with recession.
Market prices have been reflecting a contractionary phase of the cycle for several reports now. This affects conditions across all regimes, from risk appetite and market participation to the state of credit.
Marker Regime From a Participation Perspective
The most striking feature is how thin the market has become. Participation is low and has remained so for more than a month.
Measured in dollar value, capital flows are three standard deviations below their historical mean on the monthly frame.
Expressed through the scarcity regime, this corresponds to a z-score of +3—a statistically extreme reading.
Persistent below-average movements have, over time, produced the market we see today: lacking depth and extremely sensitive to any capital flow.
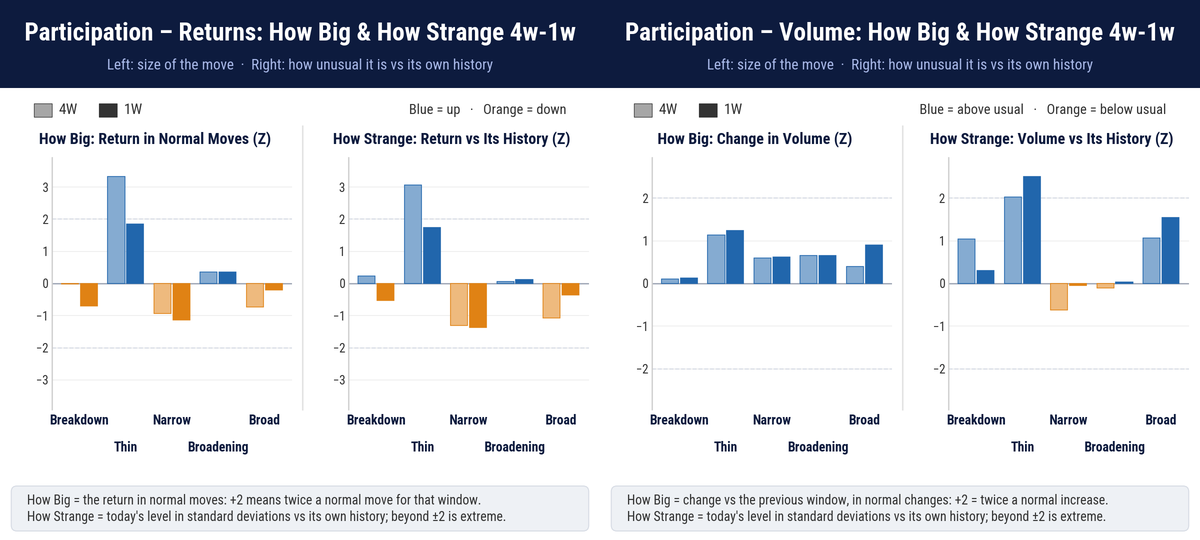
The next perspective examines participation and how unusual it is relative to the “THIN” regime’s history.Market ParticipationHow to Read: The first two histograms show return z-scores—not raw returns. They measure the size relative to the “THIN” regime’s history and how unusual they are within that regime. The last two apply the same analysis to volume: size and rarity.
The distinction matters: volume scarcity does not register extreme size z-scores, yet this volume level is highly unusual for the “THIN regime”, with rarity z-scores above 2.
We are in a statistically extreme thin-market.
Sensitivity is therefore extreme.
We should expect overextended moves and false breakouts to become more frequent.
Market Regime from a Relative Valuation Perspective
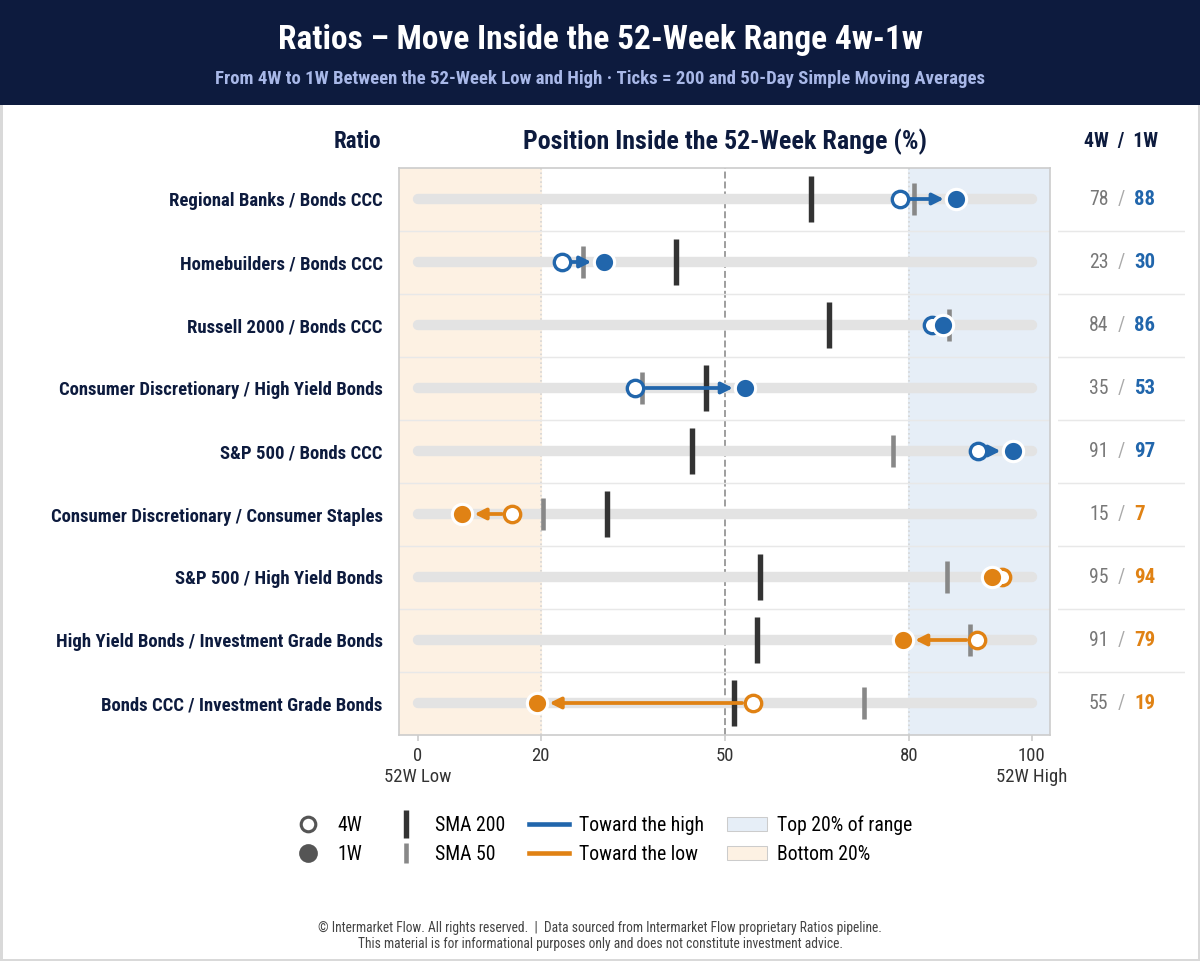
The CCC-rated bond/high-grade bond ratio, shown last, is the first to highlight. It illustrates the gap the market perceives between high-quality debt and the lowest-quality debt.
The same gap is not as evident against B-rated debt, which is slightly higher quality than CCC. We can read this as a measure of how far the credit crisis extends into equities.
We are also seeing a crisis in high-grade credit. CDS spreads on major companies involved in the AI trade are surging as well.
The other relevant ratio is Consumer Discretionary relative to Consumer Staples. This is not our main thesis—we see this market as abandoning risk—but the ratio also describes the state of the macro cycle as well as a rotation into defensive assets.
Homebuilders are the weakest sector. Even CCC-rated bonds have already formed a death cross against them, involving the 200-day average, and are now below the 50-day average.
Regional banks are under pressure but holding above the 50-day average.
The Russell, representing small companies, is already below its 50-day average relative to CCC-rated bonds.
These relative comparisons lead to the next question: how does that weakness appear in each group’s own trend and momentum?
Trend and Momentum Across Daily and Weekly Timeframes
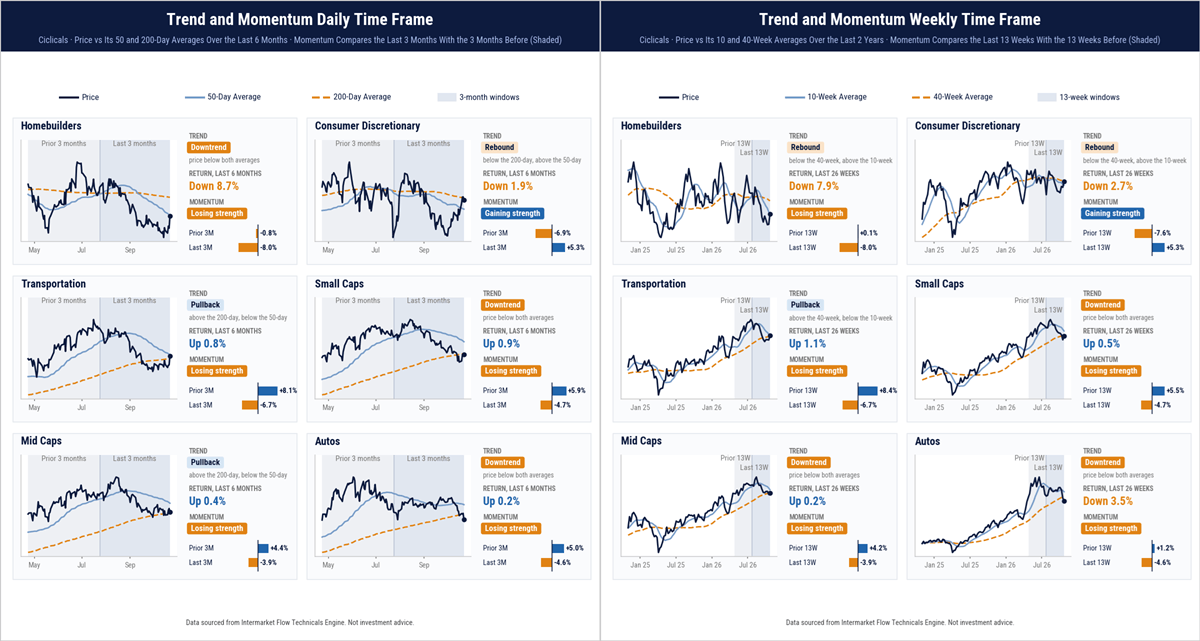
Daily. Homebuilders, Small Caps and Automobiles are below both key averages.
Transportation and Mid Caps hold above their 200-day averages; Consumer Discretionary is above its 50-day but below its 200-day.
Weekly. Small Caps, Mid Caps and Automobiles are below both key averages. Transportation holds above its 200-day average; Homebuilders and Discretionary are above their 50-day but below their 200-daily averages.
Only Discretionary shows improving momentum on a daily frame. A pullback into both averages on the weekly frame. As usual pull backs produce setups with bigger p/l.
These technical readings describe the market’s current perceptions of value. Position adds perspective but it’s not meant for predicting moves. Within this broader picture, automobiles provide a focused view of the weakness we have been tracking.
Trading Focus: Automobiles
Capital flows over recent weeks are clear. Weakness remains concentrated, for now, in small companies, interest-rate-sensitive sectors and cyclical sectors. Automobiles exemplify this thesis. Their daily and weekly technicals show how that weakness develops across both horizons.
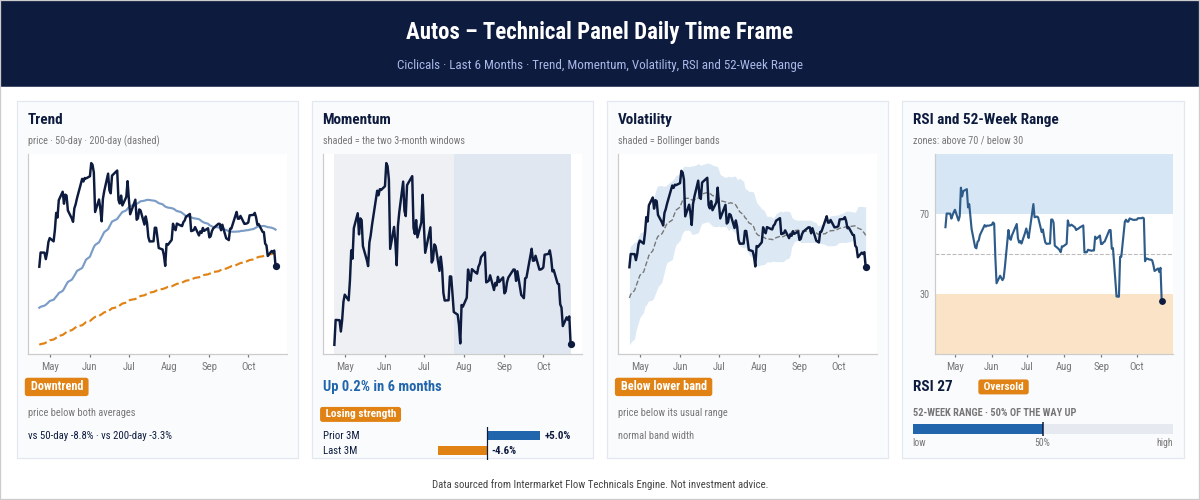
Daily. Automobiles trade 8.8% below their 50-day average and 3.3% below their 200-day. Three-month momentum shifted from +5.0% to −4.6%, leaving six-month returns nearly flat. Price is below the lower Bollinger Band, with RSI at 27, but remains halfway through its annual range. Oversold conditions do not confirm a bottom.
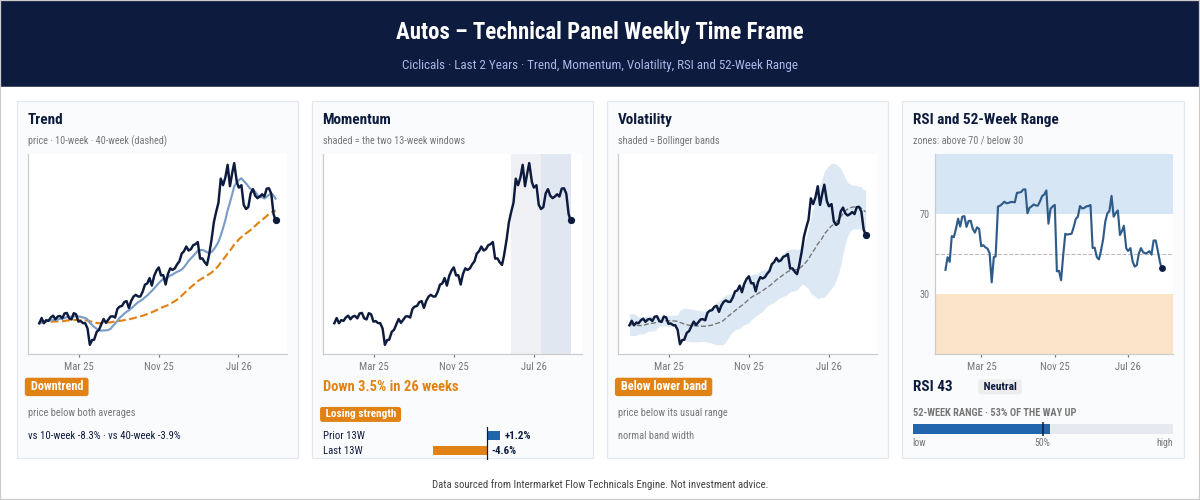
Weekly. Price is 8.3% below its 50-day and 3.9% below its 200-day average, though both still slope upward. Momentum shifted from +1.2% to −4.6%, leaving a 26-week loss of 3.5%. Price is below the lower Bollinger Band; RSI at 43 is not oversold.
Both timeframes show deteriorating trends and momentum. Daily oversold conditions could support a rebound, but a bounce alone would not reverse the broader weakness.
This is the distinction to follow in subsequent reports: whether short-term rebounds change the underlying conditions, and whether the weakness traced from bonds and credit into equities remains concentrated or extends further.
Main Conclusions
On the weekly timeframe, there appears to be a pause in the market’s shift away from risk.
This pause attracted little capital, directed toward assets with a risk-off profile.
This is not our central thesis and it is a development to monitor.
Small Caps—and now Mid Caps—are the vulnerable segment, particularly businesses exposed to interest rates on either the supply or demand side.
These are the sectors next in the transmission chain and already on our radar.
Portfolio Management
Hedges on the major indices should already be in place.
There is no case for adding risk.
At these valuations, even contrarian positioning makes no sense.
This is a market to attack, subject to investment mandates, risk tolerance and objectives.
Cash remains an offensive position.
We continue to highlight opportunities report after report. Tracking capital flows provides clarity and direction, as intermarket transmission progresses across interest rates, bonds, equities and currencies.Following their evolution week by week is key to trading with perspective, a directional bias and knowing what to expect from price behavior.
Subscribe to keep receiving these methodology for market analysis.