
Building on our recent reports, we can summarize the key developments as follows:
- With each report, more links between the bond market and equities have emerged.
- First, within the broader bond-market selloff, a credit crisis took shape.
- High yield came under pressure and remains under pressure.
- The link to Utilities then emerged.
- The most rate-sensitive sector, Home Builders, has already begun its move.
What happened this week that may have validated—or invalidated—these developments?
Market Regime from a Participation and Risk Perspective
Monthly and weekly time frames.
- Markets have accumulated weeks and months of trading volume below historical averages.
- The result is a thin, sensitive market lacking depth, where any movement of capital can trigger disproportionate price moves. (Left chart).
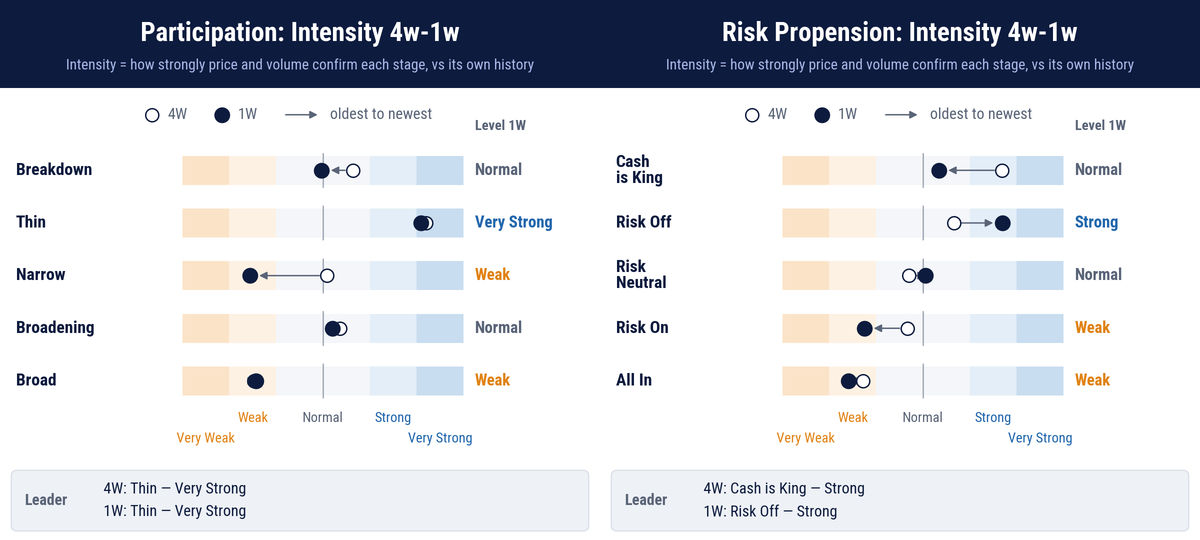
How to Read: Open circles show 4W; filled circles show 1W. Arrows track the shift between them. Further right means stronger price-and-volume confirmation relative to each regime’s own history. Left panel: market participation. Right panel: risk appetite.
- In the monthly time frame, Cash Is King is by far the predominant risk propension.
- The past week saw a rotation toward Risk Off, probably a correction but a thing to keep on radar.
- Meanwhile, Risk On and All In Risk continue to disappear
More on methodology and z-scores here.
Market Regime from a Volatility Perspective
The regimes described above give rise to this market psychology.
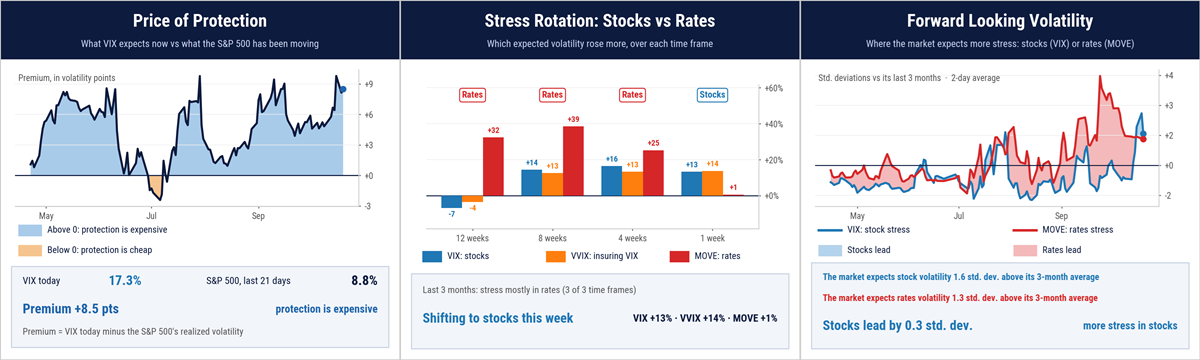
- The S&P 500 is not moving yet, but the VIX anticipates substantial movement over the next 30 days, pushing hedging costs to their highs. (Left chart).
- If you did not hedge earlier—a main conclusion of previous reports—doing so is now expensive.
Why is fear of a major move so extreme when the market itself is barely moving?
- The middle chart illustrates the transmission of volatility from bonds to equities over the past 12 weeks, with elevated interest rate volatility beginning to spill over into the VIX and VVIX.
- The process has already reached a stage where expected interest rate volatility is lower than expected equity volatility within the next 30 days, as shown in the third chart.
Technical Position of the Major Asset Classes: Implications
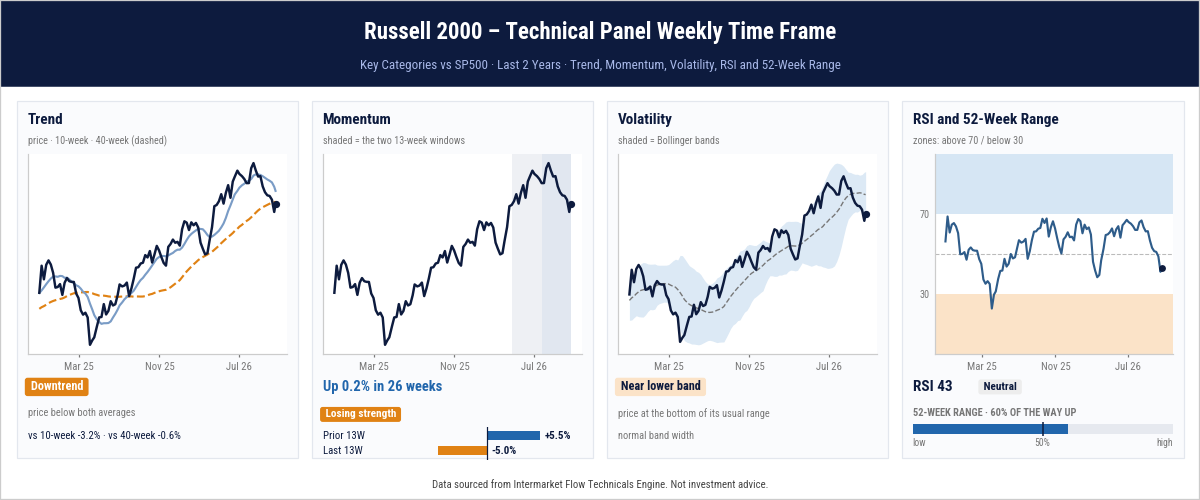
The major indices show differing levels of strength. The S&P 500 is in a precarious technical position, lacking momentum and resting on its 50-day moving average.
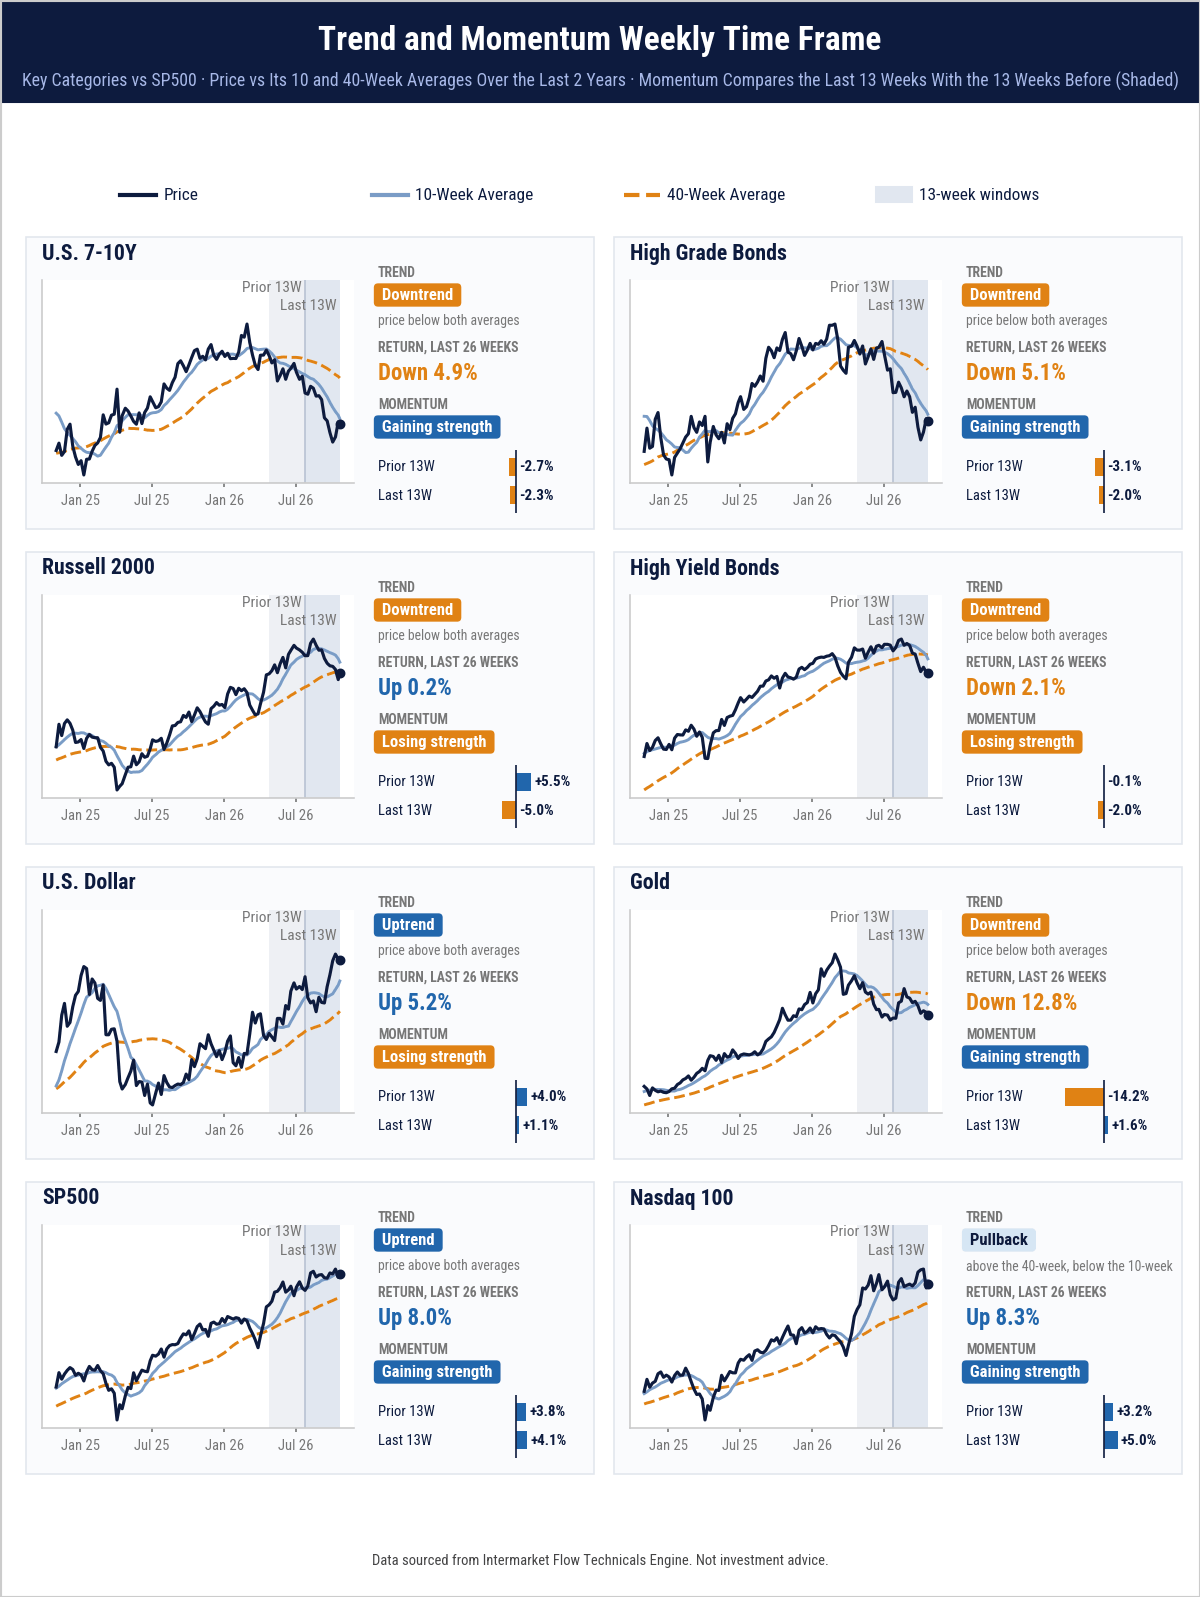
- Its contrast with the Russell 2000, already below its 200-day moving average, illustrates the disconnect.
- From this perspective, the Nasdaq’s recent price action shows greater weakness.
Sometimes, it is easier to identify where prices cannot—or do not want to—go than to anticipate where they will go.
Market Regime from the Perspective of Asymmetric Opportunities
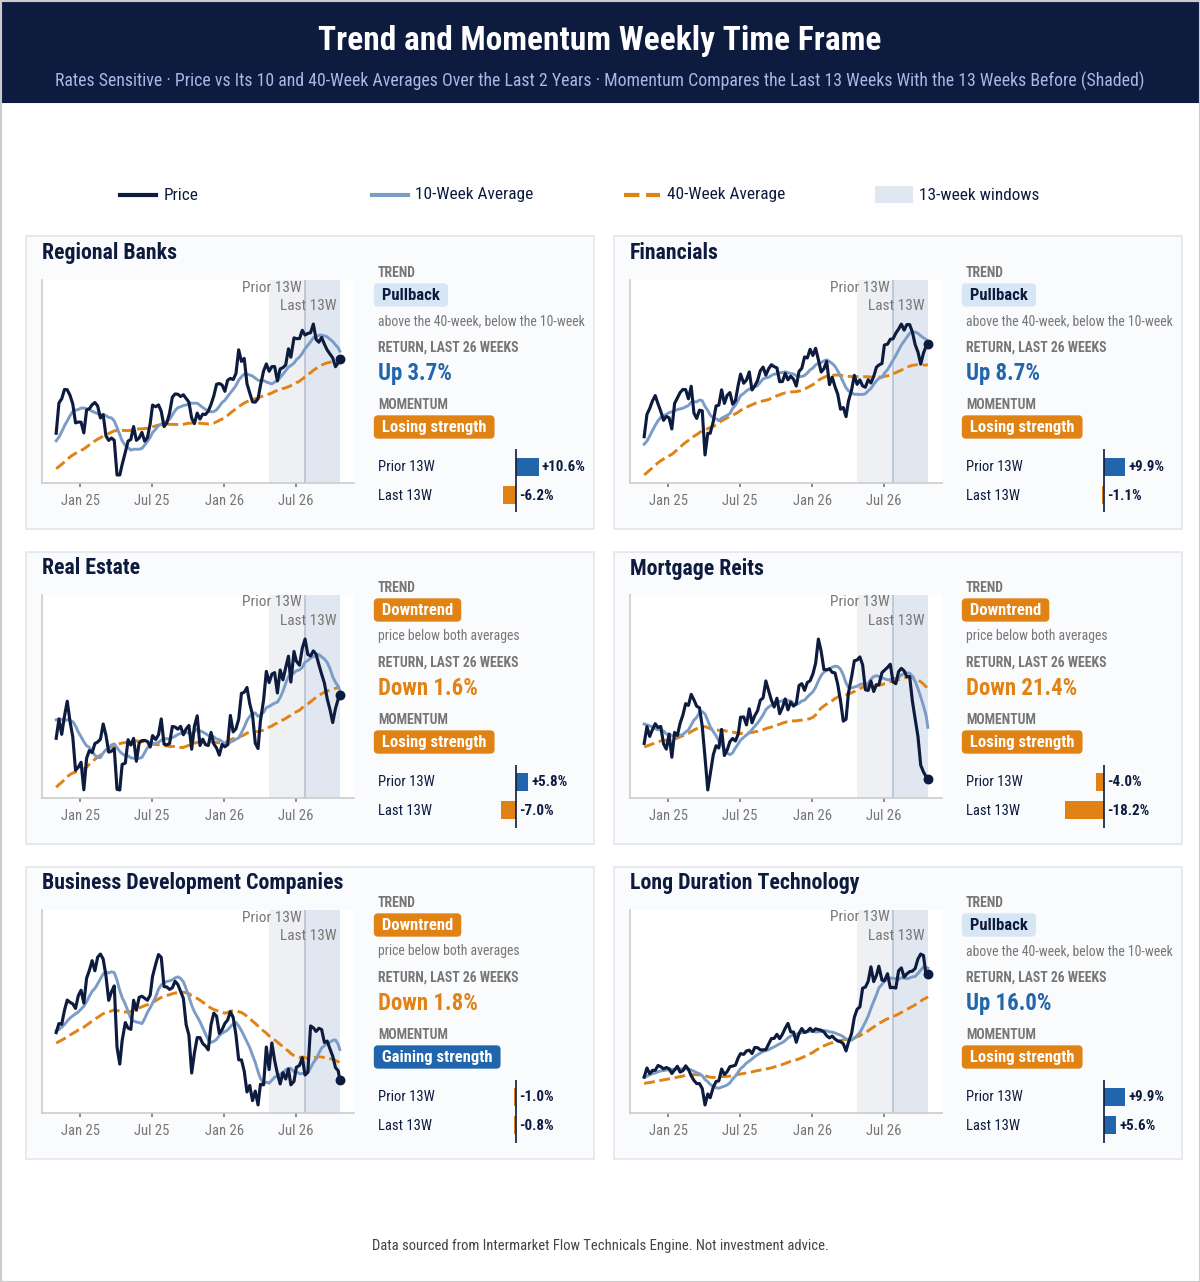
- The difference in strength between small banks and the broader financial sector. (First row). The main hypothesis developed in our recent reports centers on small caps’ greater exposure to interest rates compared with large caps.
- Mortgage REITs: the financial side of the housing market shows considerably greater deterioration than the property ownership side. Those providing financing are experiencing an adjustment that has yet to reach property owners. This asymmetry signals potential transmission. (Second row).
- Long-duration technology stocks are in a precarious technical position.
- A correction in this sector, the sole market leader, would drag down the major indices, which are already at the brink but have yet to correct.
- Business Development Companies exposed to private credit are another sector already correcting—and another link between bonds, interest rates, and equities.
Our Risk Thermometer
A prolonged correction has brought it to its 200-day moving average.
- With no momentum and stretched volatility, some mean reversion is to be expected.
- This is not a buy-the-dip opportunity.
- The current level and trend confirm the conclusions we have been highlighting for weeks. Small caps are exposed especially in rate sensitive sectors.
Course of Action
- Even expensive protection may be better than having none.
- Market breadth and its counterpart, concentrated leadership, reflect risk: concentration and overcrowding.
- This is the risk the market charges a steep premium to hedge.
Portfolio Management
- For dollar-denominated portfolios, hedging currency risk is often overlooked.
- The dollar is at elevated levels relative to other currencies, which puts it on the radar as an exposure to diversify.
- Several instruments are available, and hedging this exposure means choosing among imperfect alternatives.
- The key is to recognize that concentration in AI means risk—not just for AI-related assets, but for the entire market, because AI is carrying a market that is weakening everywhere else.
- The degree of this concentration is the measure of risk.
- Today’s course of action is capital preservation. Cash and cash equivalents are an offensive position.
Opportunities are coming!
A portfolio’s annual return often comes down to a few months—or even weeks—of market activity.Intermarket transmission is underway.
Subscribe to follow it closely.
Intermarket Flow
If you believe this is an error, please contact the administrator.