
Bond Market Stress: How Is It Spreading to Equities?
A Recap of Recent Reports: Where We Stand
- A credit crisis is unfolding beneath the broad bond selloff.
- Repricing remains incomplete: major equity indexes have yet to fully reflect the yield curve shift.
- Volatility divergence persists: the extreme MOVE–VIX gap remains, while small-cap volatility rises against broader equity compression. ( Volatility divergence persisted until this week).
- Transmission is advancing through two channels: from bonds through high-yield credit to small caps, and from bonds to utilities.
What Has Changed in Recent Days
When we broaden the time frame to identify the variable driving the market today, we see a single player dominating the entire field.
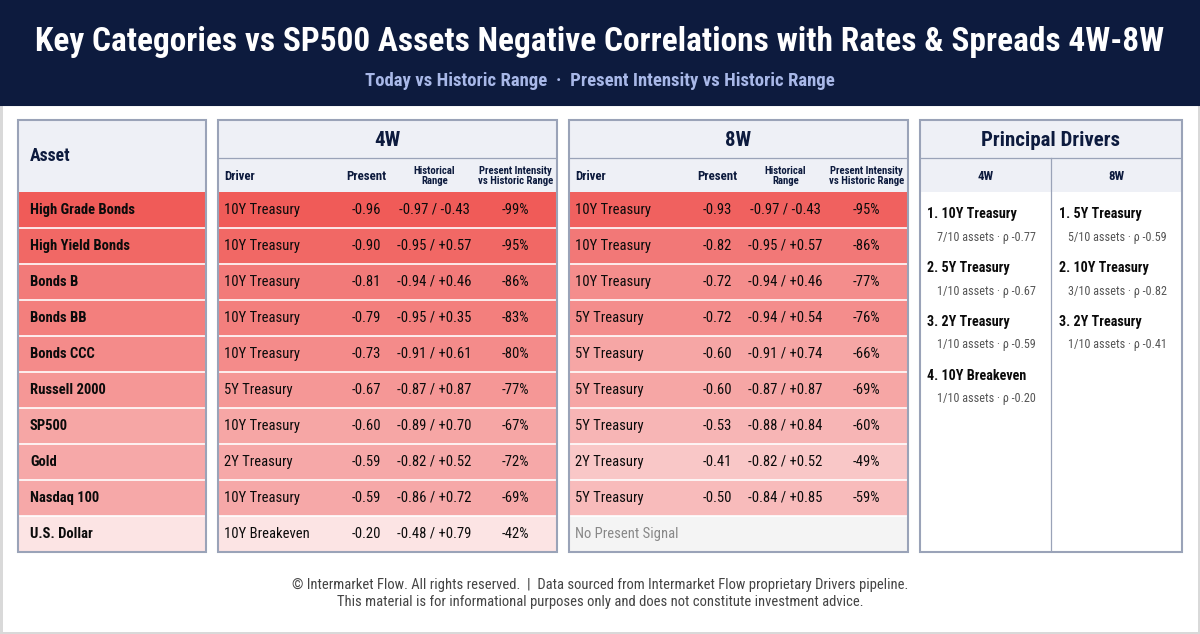
- The 10-year yield and its components—real yields, inflation expectations, and the term premium—are the sources of uncertainty.
Bond Market Stress: From Credit to Small Caps and Homebuilders
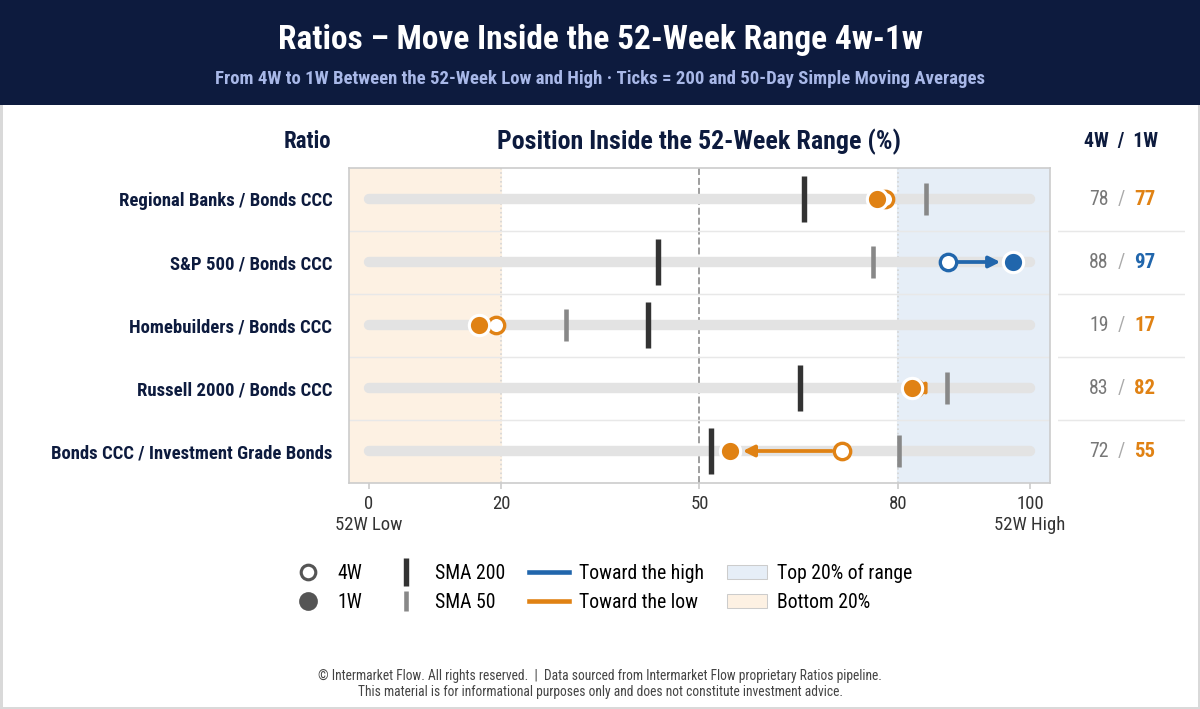
- Tracking relative ratios against CCC-rated bonds reveals how far transmission to equities has progressed and where pressure is intensifying.
- Homebuilders are already weaker than CCC-rated bonds, themselves at the center of a credit crisis. Below its 200-day moving average, the sector is the weakest of the group, joining utilities as a link between the bond and equity markets.
- Regional banks and Russell are beginning to follow, in that order—all sectors we have been monitoring in the last weeks.
- The final ratio shows the credit crisis embedded in the broader bond exodus driven by a duration adjustment.
- The CCC/Investment Grade bond ratio has fallen from 72 to 55, breaking below its 50-day moving average and approaching its 200-day average near 52. CCC’s clear underperformance reflects a preference for quality. A break below 52 would mark the transition from a correction to an established trend.
Equity Volatility: Why Index Hedges Are Back in Focus
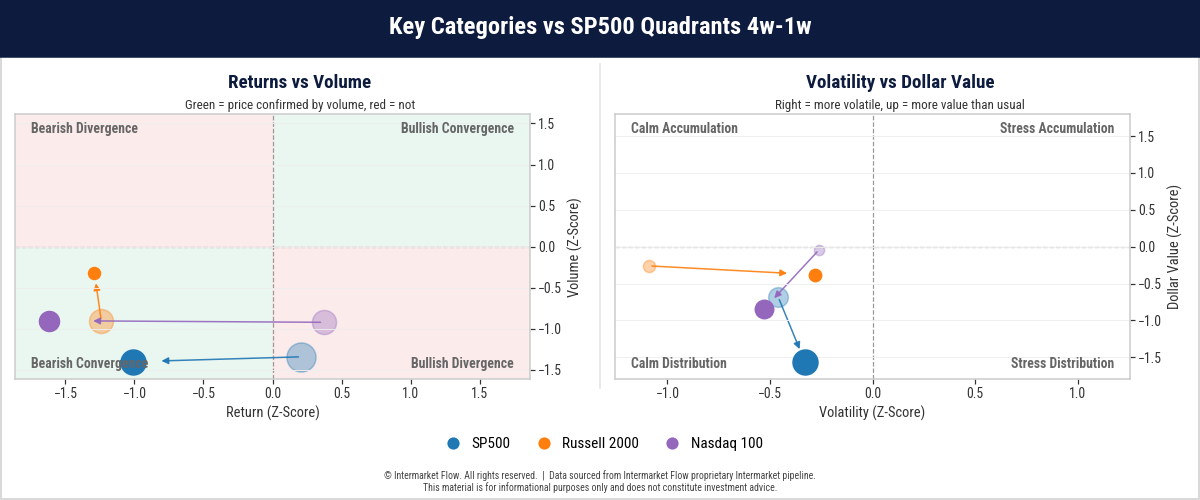
- A bearish convergence is evident across all of them, despite trading at or near all-time highs.
- Volume continues to contract week after week alongside returns. Market participation is increasingly thin, yet volatility remained fully compressed until yesterday.
Equity Volatility Perspective
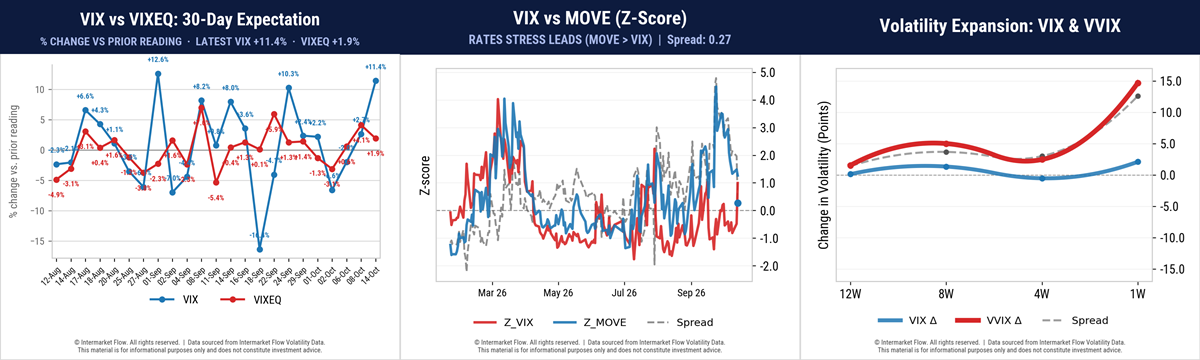
- For weeks, a substantial gap persisted between bond and equity volatility. The duration adjustment—and the credit crisis embedded within it—had yet to spill over into equities.
- The VIX rose 11%, while VIXEQ—the implied volatility of S&P 500 constituents—edged up just 1.9%.
- The market is not pricing larger individual stock moves; it is pricing stocks moving together.
- Institutional capital is buying index hedges rather than protection on individual names.
- This is entirely consistent with lagging equity volatility, incomplete repricing of the yield curve shift, and the persistent disconnect observed in recent weeks.
- Equity volatility is finally catching up with bond volatility (middle chart).
- This becomes clearer in the third chart, where the ΔVVIX is accelerating faster than the ΔVIX.
The Risk Gauge We Have Been Tracking for Weeks
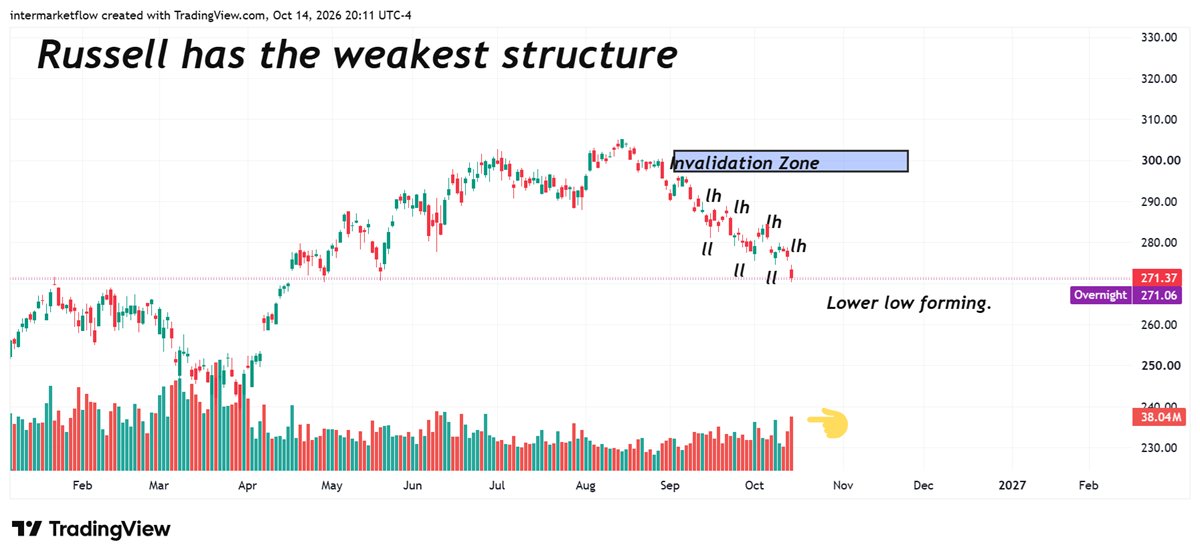
We are sharing this chart once again—it remains our guide in the current market.
- The yield curve shift hits small caps through multiple channels. Until this risk is resolved, it remains a constant source of instability—making small caps our risk gauge.
What Has Changed Since the Previous Report
- The VIX is adjusting higher, closing the gap that needed to close.
- Homebuilders join utilities among the sectors affected by spillovers from the bond market.
- Intermarket causality points to the next sectors in order of their interaction with interest rates: financials, technology, and the more rate-sensitive consumer discretionary and industrial sectors.
- All are already under pressure and technically on the verge of a correction. As we have seen in previous reports.
Course of Action and Selected Charts
Our approach remains largely unchanged from previous reports:
- The need to hedge major equity indexes is becoming more pronounced.
- Homebuilders enter our radar as another vehicle for expressing the bearish view.
- The intermarket sequence is clear, although technology could deviate from it. With the sector heavily influenced by the AI trade, its behavior is difficult to predict.
- Transmission has nevertheless bypassed technology and is already reaching the next sectors in the sequence.
A Technical Perspective
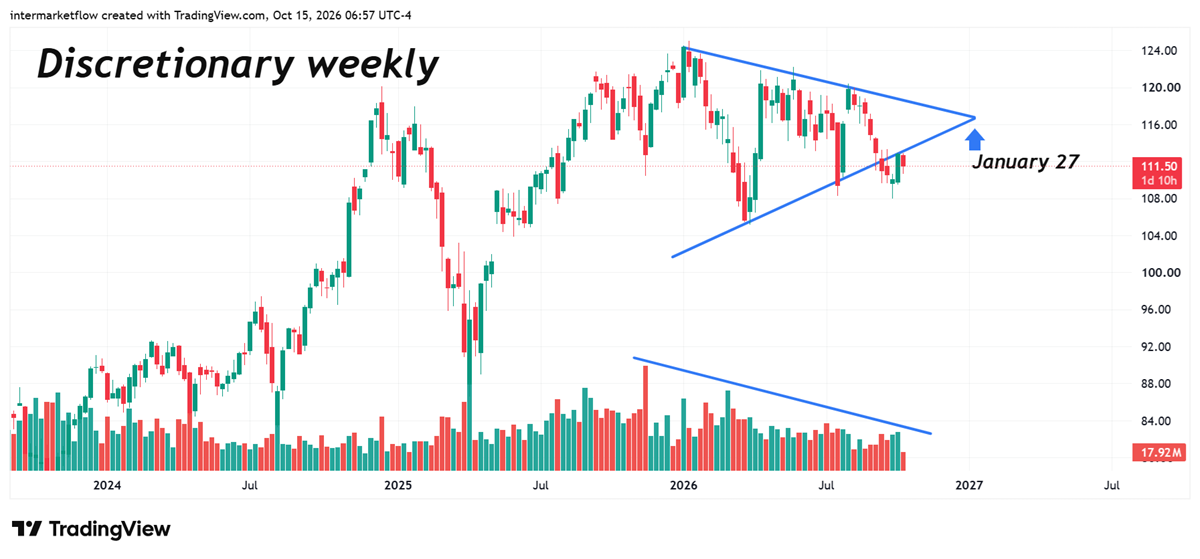
- January 2027. This situation should be resolved by then, if it has not been already.
- Technically, this is a retest of the breakdown—a setup that generally offers a favorable risk/reward ratio.
Markets can go weeks without much happening—until everything happens in one. If you’re not prepared, it will likely cost you far more than $65 a month.
Become a paid subscriber. Stay prepared.
Intermarket Flow
OR
UPGRADE
Free trial has expired.
If you believe this is an error, please contact the administrator.
If you believe this is an error, please contact the administrator.
OR
UPGRADE