
Is the liquidity leaving the dollar, building a new market regime, or merely moving prices across fragile markets?
This week’s evidence points to the latter.
- Liquidity is moving prices, but it is not rebuilding market depth.
- The dollar is under confirmed distribution, yet the rest of the asset map remains fragmented.
- Some markets are absorbing liquidity with genuine participation, while others continue to expel capital despite partial price recoveries.
- Others are so thin and sensitive that even a small inflow or outflow produces a disproportionate price move.
- Defensives and Financials show the cleanest positive convergence.
- Credit is rebounding on weak volume.
- Growth and long-duration assets remain under active distribution.
Macro Diagnostics: Dollar Liquidity Release
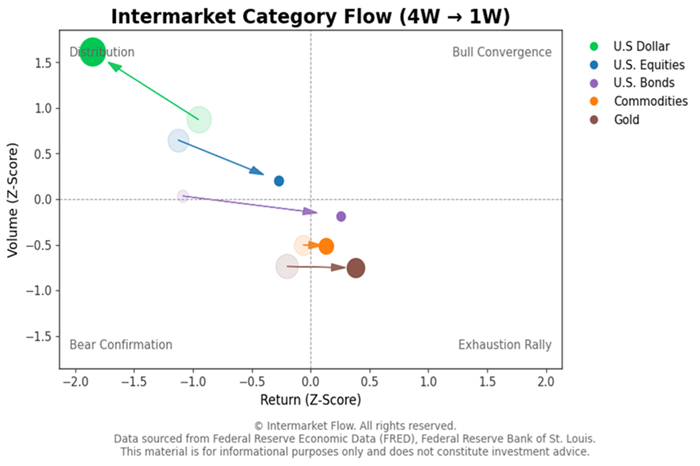
- The dominant 4W-to-1W signal is confirmed U.S. dollar distribution: “Z_RET −1.85” with “Z_VOL +1.60.” Dollar weakness is therefore occurring on materially above-average activity, making it the clearest source of liquidity release across the asset map. That capital outflow, of course, must find a destination.
Market Depth
Long term Treasuries
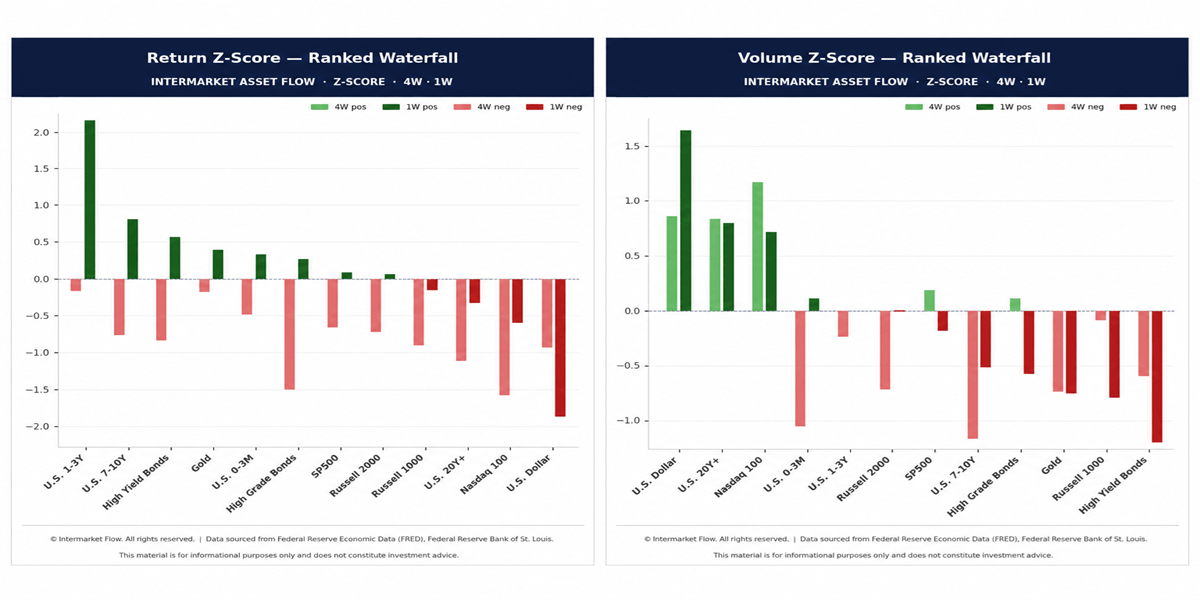
- “Z_RET −0.34,” “Z_VOL +0.81,” “Z_VOLAT +1.75.” Active selling and rising instability confirm persistent structural pressure at the long end. Long-term credit shows a similar, though less extreme, pattern. In both categories, the liquidation is duration-driven rather than the result of operational or credit stress.
Short Treasuries
- “Z_RET +2.18,” “Z_VOL 0.00,” “Z_VOLAT −1.30.” Limited depth is amplifying an orderly price move. Flows are entering on average volume, with neither panic nor urgency. This looks more like a refuge driven by a lack of alternatives than a high-conviction allocation.
High Yield
- “Z_RET +0.56,” “Z_VOL −1.28.” Prices are rising on the weakest participation in the market, leaving High Yield exceptionally vulnerable.No other market saw weekly volume fall as sharply. There is no interest and the market is too thin to be operationally reliable.
Investment Grade
- Despite this, the market shows a similar pattern to the one described above, but at roughly half the intensity. There is no generalized credit stress. For that diagnosis to hold, the relationship between High Yield and Investment Grade would need to deteriorate materially. For now, it remains consistent with normal conditions.
Volatility, Participation, and Market Depth
Nasdaq 100
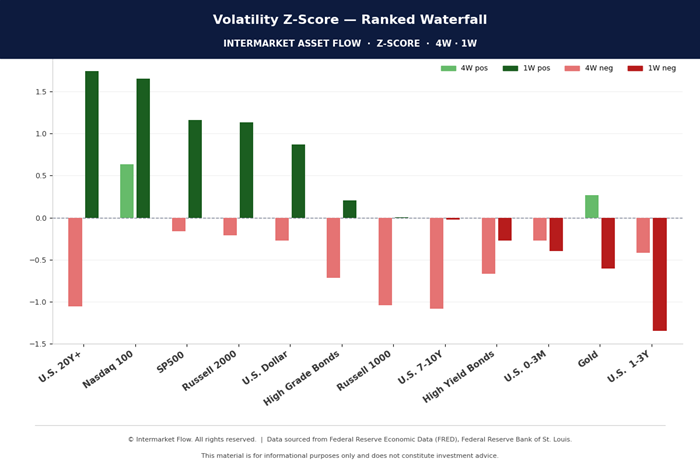
- “Z_RET −0.60,” “Z_VOL +0.72,” “Z_VOLAT +1.65.” Negative returns, above-average participation, and expanding volatility form a clear bearish convergence, confirming active distribution and weak market depth. Sell rallies.
U.S. Dollar
- “Z_RET −1.85,” “Z_VOL +1.60,” “Z_VOLAT +0.85.” High participation and expanding volatility confirm forceful dollar distribution.
Conclusion:
- Nasdaq 100 shows the clearest bearish convergence. (Avoid and short rallies).
- Long Treasuries and the dollar also face active pressure.Credit’s vulnerability comes from exceptionally weak participation especially on low quality credit.(Avoid)
Sector Allocation & Flow
Credit Sensitive
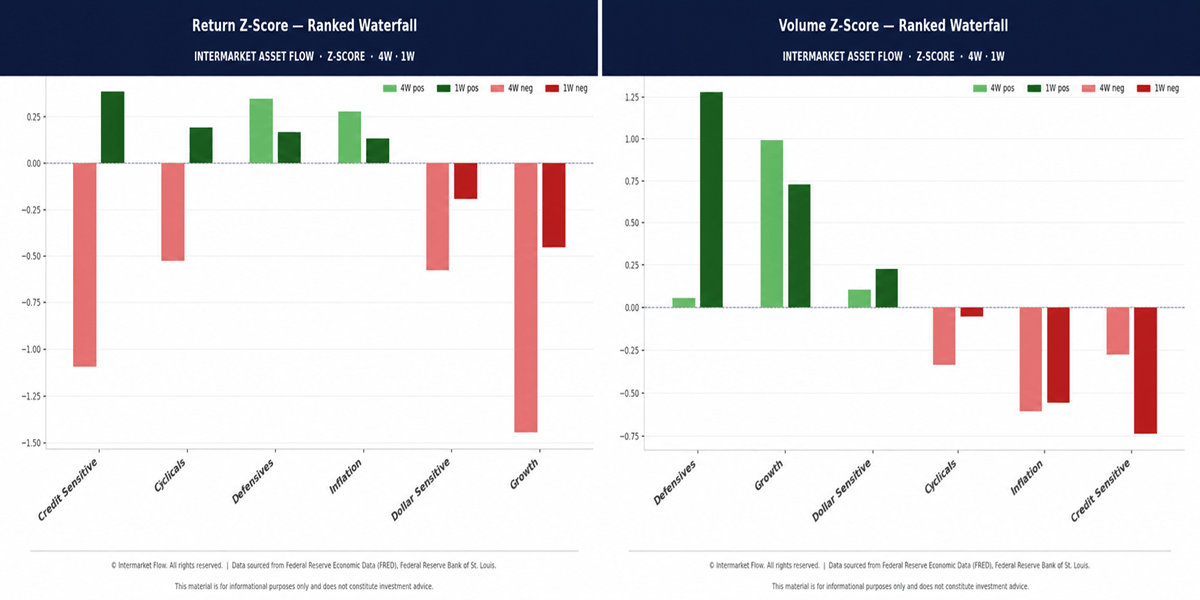
- Z_RET rises from −1.10 to +0.40, while Z_VOL falls from −0.25 to −0.75. Credit is rebounding without participation, confirming a thin and fragile move. It is a market that cannot be trusted.
Defensives
- Z_RET holds near +0.20 as Z_VOL rises to +1.25. This is the clearest positive convergence and the strongest destination for current flows.Capital is flowing into the category, but the market has sufficient depth, keeping the price response proportionate and relatively contained. As noted in previous reports, this market has been accumulating for the past two to three weeks. Hold, overweight, and look for assets with the same profile across other asset classes.
Growth
- Z_RET remains negative near −0.40, with Z_VOL at +0.75. Negative returns with elevated participation confirm active distribution. No long exposure
Cyclicals
- Low volume is producing a disproportionate price move, confirming limited market depth as the primary driver. The advance is therefore neither structurally sustainable nor operationally reliable. Avoid
Volatility Context
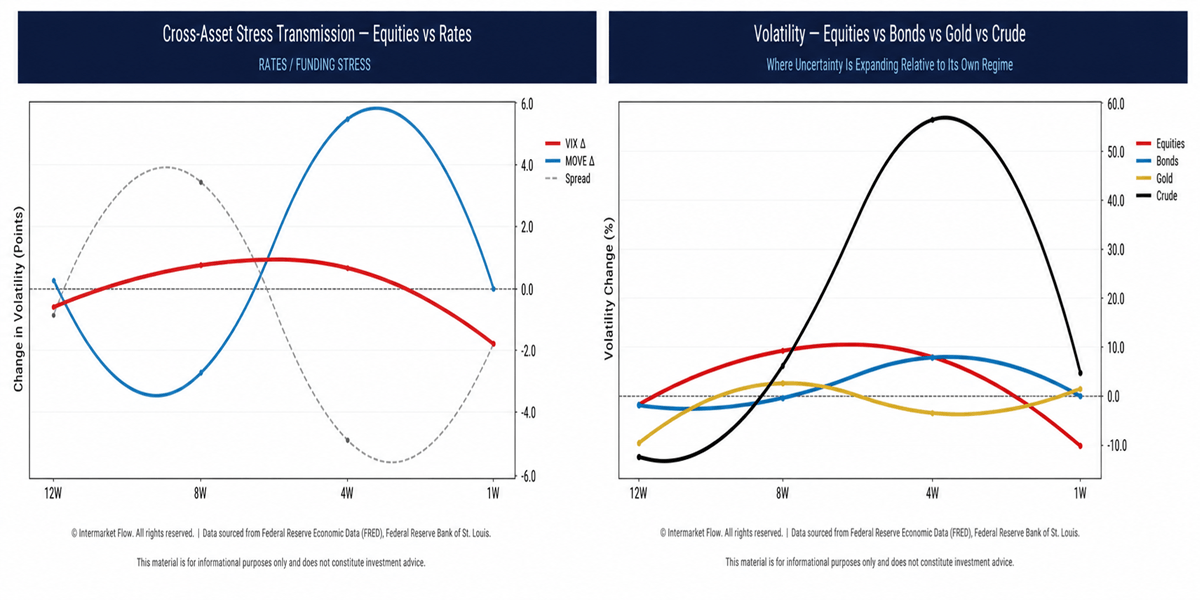
How to Read:Left: compares VIX and MOVE to identify whether stress is being transmitted through equities or rates.Right: compares volatility across Equities, Bonds, Gold, and Crude. Rising lines signal expansion; falling lines signal compression.Conclusion: Volatility shocks are fading across rates, equities, and energy. The market is pricing stability, but not necessarily strength: with volatility compressing while depth remains uneven, even a modest new shock could trigger a disproportionate repricing.
- Rates and energy shocks have decelerated sharply. MOVE is near neutral, VIX is contracting, and only Crude retains a modest positive volatility impulse.
- With depth still limited and volatility compressed, even a small macro shock could trigger an outsized market reaction.
Strategic Verdict
- There is no broad Risk-On regime.
- Dollar distribution is releasing liquidity, but it is not rebuilding market depth.
- Capital is concentrating in Defensives, where bullish convergence and accumulation remain intact.
- Growth and long-duration assets stay under active distribution.
- Credit is rebounding on exceptionally weak participation.
- Short-term bonds are absorbing flows mainly because they remain the least-bad alternative.
- Stressed sectors experiencing extraordinary capital outflows.
- At the same time, volatility shocks are fading: MOVE is near neutral, VIX is contracting, and only Crude retains a modest positive impulse. But this stability is misleading.
Final message: the market is defensive, fragmented, and vulnerable. With limited depth and compressed volatility, even a modest macro shock could trigger a disproportionate repricing.
Charts
A look at several charts we’ve been tracking and sending through the service and how they have evolved. Here and Here
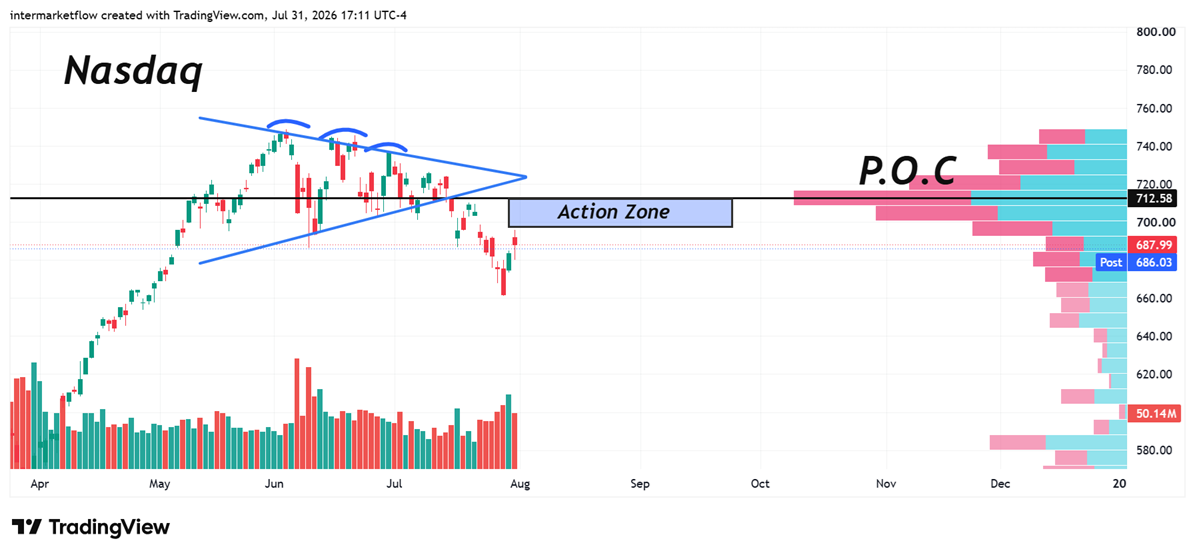
- Nasdaq is technically tracing a textbook bearish pattern with bearish convergence.
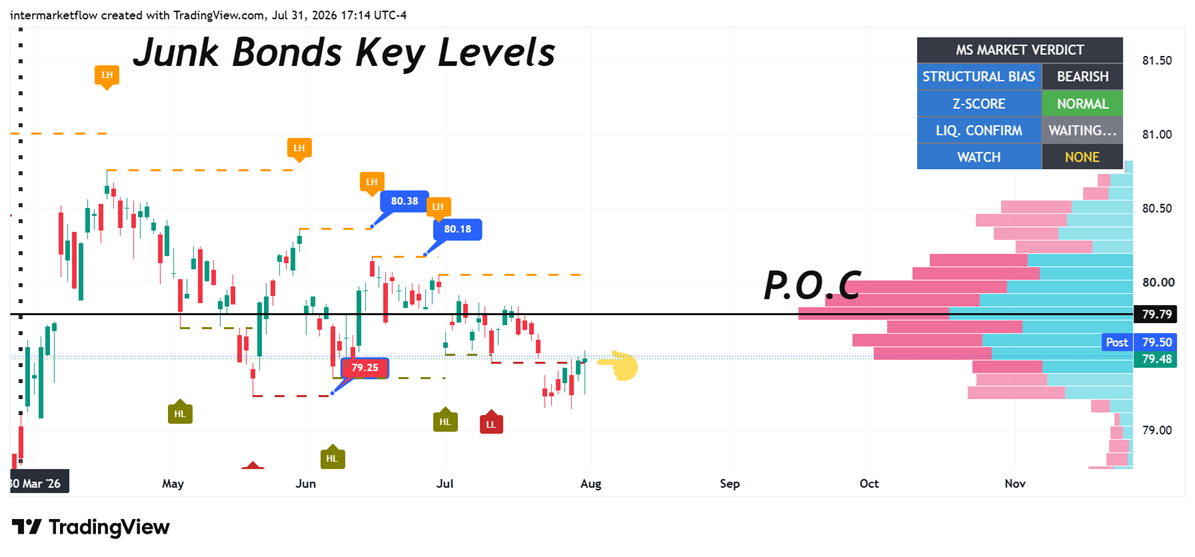
- High Yield is gradually deteriorating. The key difference is that the counterpart, High Grade is also weakening—just at a slower pace.
Intermarket Flow
OR
UPGRADE
Free trial has expired.
If you believe this is an error, please contact the administrator.
If you believe this is an error, please contact the administrator.
OR
UPGRADE