The 30-year rate. Technical and Macroeconomic Perspective
Anticipating the Recession
Those who cannot remember the past are condemned to repeat it.” – George Santayana The Life of reason 1905.
The Reaction Function of the FED and Any Central Bank with the Same Mandate

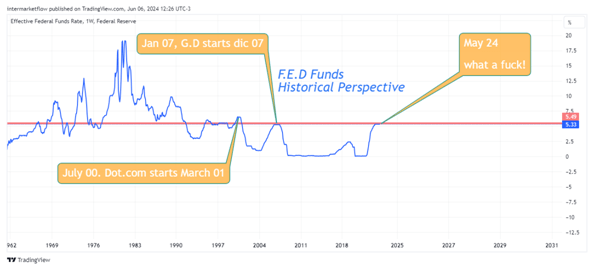
The reaction function of the FED is crystal clear and very logical. It has two mandates related to employment and inflation and balances its decisions by trying to maximize one without exceeding the 2% annual inflation ceiling.It raises interest rates to discourage consumption. This slows down the economy, reducing inflation but also potentially increasing unemployment. Timing and expertise determine this delicate balance. From 1990 until today, that has been, is, and will be its reaction function. We already know in advance what it is going to do, and by looking at history, we also know what is going to happen.
Start of Rate Cut Cycle and Recessions
| Recessions | Start easing cycle until recession/days |
| Jul-90/Mar-91 | 455 |
| Mar-01/nov-01 | 119 |
| Dic-07/Jul-09 | 217 |
| Feb-20/Abr 20 | 273 |
| Av.Days | 266 |
| Av.Months | 8,9 |
| Av.Years | 0,7 |
The last four recessions were preceded by a cycle of rate cuts. All four. On average, the recession started, read carefully, 266 days after the start of cuts. Today, the cuts haven’t even begun. The market fluctuates between discounting one or two cuts in 2024, or none if some twisted data comes out.
In this table, we show the lag that existed between the start of each rate cut cycle and the start of the recession. I’m not yet talking about yield curve inversions. I’m simply showing that post the start of a rate cut cycle, there has always been a recession in the past. The mainstream media and the “consensus” talk about a “soft landing,” and it turns out the plane hasn’t even taken off yet. Breathe. Let that sink in. Just knowing this puts us a step ahead of the average.
If one were to go by averages, wich can never be exact, if the first cut were to occur at the end 0f 2024, the start of the recession would start in July-August-September 2025. Soft landing my ass.The plane hasn’t taken off yet.
Yield Curve Inversions and Recessions
| Recessions | Invertion Date | Leads-Days | Leads-Month | Leads-Year |
| Jul-90/Mar-91 | abr-88 | 987 | 33 | 2,70 |
| Mar-01/Nov01 | jul-96 | 791 | 26 | 2,17 |
| Dic-07/Jul-09 | 0ct-05 | 770 | 26 | 2,11 |
| Feb-20/Abr-20 | Jan-19 | Not relevant-Covid | ||
| Today | 0ct-22 | 693 | 23 | 1,90 |
| Av.Time | 810 | 27 | 2,2 | |
The yield curve, much more reliable because it includes the reaction functions of economic agents, people, businesses, families, and the government, inverted beforehand in all cases. On average, almost 2 years before the start of the recession.
The Reaction Function of People, Families, and Businesses
The reaction function of people can be interpreted through the spread between the 30-year rate and the FED’s rate. It shows how people view future or long-term rates relative to today’s rates. If people see a flourishing economy in the future, the spread, represented by the blue line in the chart below, should have a positive slope. This would be a normal, bullish yield curve, steep with higher future yields. This is a direct message from people and markets about their expectations.
I don’t want this to get too technical, but if people see 30-year rates lower than today’s rates, they are basically telling you that they don’t see anything good at the end of the road. This is the reaction function of people. It is always the same because it reflects the reasonable and human reactions of market participants.

The Two Reaction Functions Together and Recessions
Looking at history, patterns repeat. How could they not, if after all, even with cell phones and everything, we are still human, sensitive to risk, and in almost all cases, though not all, reasonable beings?
When the difference in this two rates is at its maximum, between today’s rates and 30 year rates, that’s the inflection point. That’s where things change direction. Just before 1990, 2001, and 2008. I consider the case of 2020 as an outlier. A pandemic changes the usual reaction functions, but even so, the pattern formed before the recession.
Going Deeper. Why?

Each time, before reaching a recession and before the FED starts its rate-cutting cycle, the difference between the Fed Funds and the 30-FED Spread is at its maximum. Why? Basically, people see everything going poorly in the future, and that’s when the FED has to start cutting rates. Almost always, it’s when something important breaks.
This situation could be seen as a “self-fulfilling prophecy” prior to the F.E.D’s reaction. People see a bleak future, adopt a defensive stance, which then causes the future downturn and triggers the F.E.D’s reaction
But I wonder, what is happening right now?
If that difference is at its maximum, the recession and the start of rate cuts are imminent. I don’t see any upward momentum in the FED rate at all. It might stay where it is, but I don’t see it rising. Look at what history tells us.

We are at historically high levels similar to those in ’01 and ’08. This doesn’t look good. So, what now? We’re here and we believe the short-term rate won’t rise. What happens with the 30-F.E.D spread?

Main Conclusion
If we are indeed at the maximum difference, the spread should go up. We don t se short term rates rising, that means that the 30-year rate should not fall but rise, or short-term rates must drop. Or a mix in the rate changes between them that allow the spread to rise. Anticipating the F.E.D’s decision is more transparent through the study of the 30-year spread to Fed funds rate. The F.E.D operates according to its own reaction function, which we already understand. The spread incorporates the reaction function of all economic agents and is, therefore, a much more comprehensive and leading indicator.
The 30-year rate. Technical and Macroeconomic Perspective.
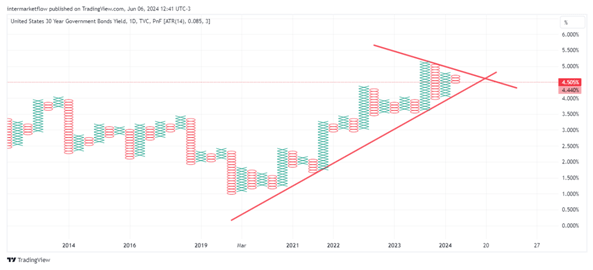
Technicals: For the fans of Elliot Waves: The 30-year rate.

Trends:
Day: Correcting within a primary uptrend.

Week: That's a correction within a higher degree uptrend

Month: It's within the higher degree downtrend that has been in place since 1987. Right now, it’s testing that trend.

To go deeper, we need to delve into momentum, mean reversion, and the time factor within cycles.
And in addition to that, the entire macro view…
… whew, my head hurts. I hope you enjoyed it. We loved writing it, honestly.
Thanks for reading this far. If you liked it, you can follow us on @intermarketflow or at www.intermarketflow.com.
The deepest part of this report, where the setups are formed, is sent directly via email to subscribers. Do so. It won’t cost you anything and it makes our day.
Stay in touch.
Martin
Intermarketflow.com
- Intermarketflow
