Intermarket Analysis Throught Macro and Technical Methods
Trading sectors in a bubble environment.
In this article, you’ll find:
- The relationship between momentum and Vix. The relations with mean reversion.
- The importance of tracking momentum at extreme or overextended price levels.
- Relative ratios between sectors.
- Where we see opportunities and where we don’t.
- A general view for portfolio positioning today.
Description of the Current Market Situation and Its Causes.
The Structure of the Bull Market.
When prices reach extreme levels, observing momentum becomes crucial. As a trend consolidates and reaches new highs, the pace at which it moves eventually slows down until a natural correction occurs.
This change in pace is what we know as momentum, one of the three pillars of technical analysis.
Let’s remember:
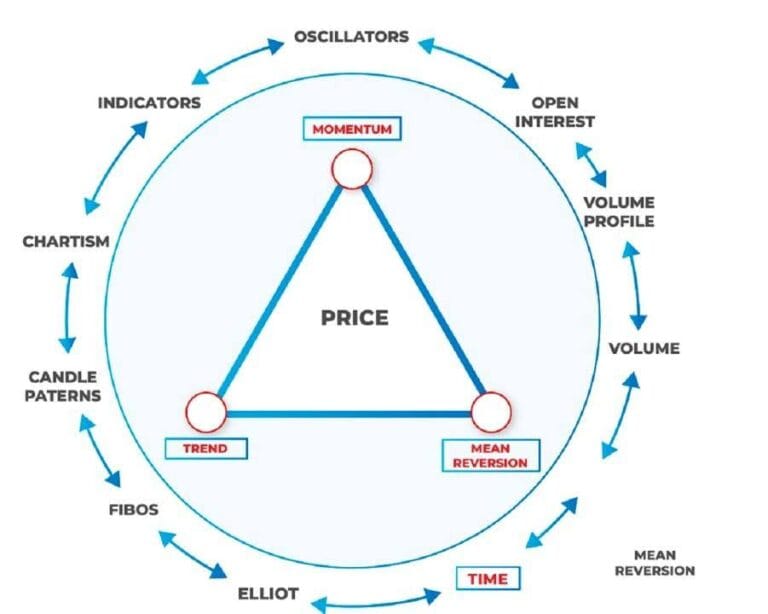
We could view the drop in momentum as the stage preceding a reversion to the mean. This becomes more noticeable at extreme price levels, following overextended trends.
Momentum and VIX
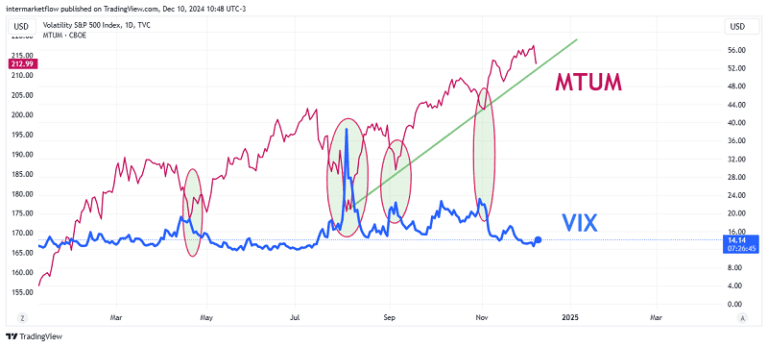
Naturally, whenever there is a break in stock momentum, it coincides with a rise in volatility. However, this hasn’t happened yet. The VIX remains at lows, with significant price compression.
Available Tools:
- Macro Hypothesis: Our macro hypothesis is supported by various types of analysis.(here).
- Volatility Will Rise: We know that sooner or later, volatility will increase.
- Momentum Weakening: Momentum, which analyzes recent price trends, is declining. It doesn’t factor in the latest data, as the indicator focuses on the strength of recent prices and assumes that strength will persist in the near future.
- Unsustainable S&P 500 Structure: The S&P 500’s structure can continue, but not indefinitely. This is due to several factors, including fewer buyers and the fact that it relies heavily on short-term expectations of tech earnings. At some point, these expectations won’t be met because valuations will become too high.
- Historic High Valuations: The S&P 500 is trading at historically high valuations.
- Dividend Yields: Expected 12-month dividend yields are just 1.4%.
Real rates, the Key Driver:
Much of this is happening because real interest rates remain low, particularly the 10-year yield, hovering around 1.5%. The 2-year real yield is at 1.6%. These low rates are pushing everything upward.
Key Industries Poised for Growth or Decline
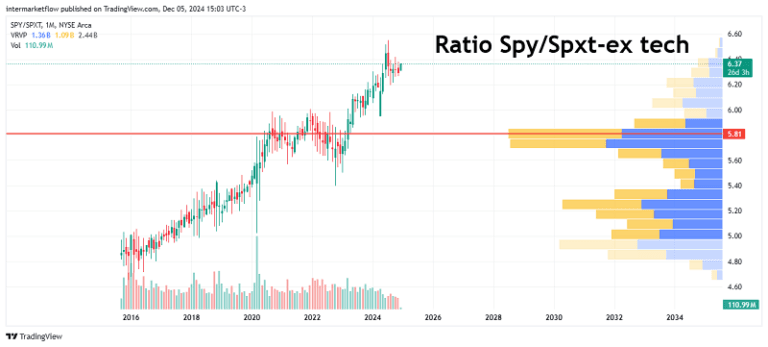
One way to identify weakness is through sector analysis and their valuations relative to a common index. In this case, we won’t use the SPY because it is completely distorted. Instead, we’ll use the SPXT (ex-tech) to get a more realistic view.
Spy/Spxt (ex tec), Momentum and Vix
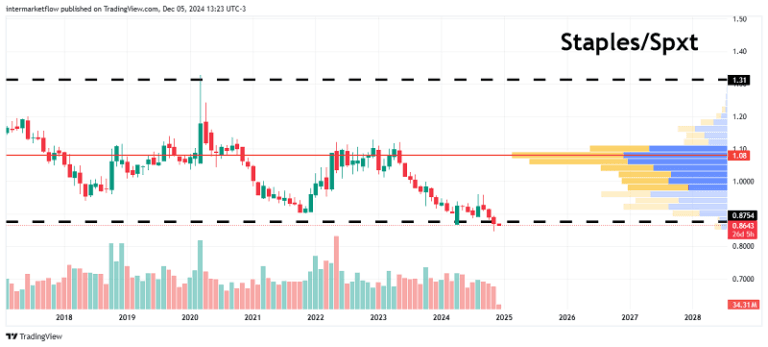
Staples Sector = Cheap
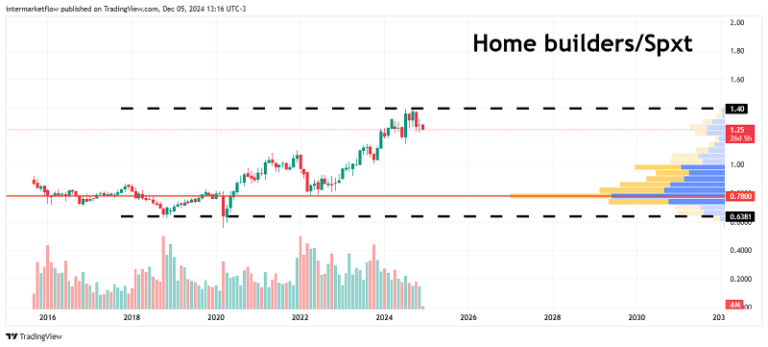
Home builders Sector = really expensive.
Industrial Sector = Expensive.
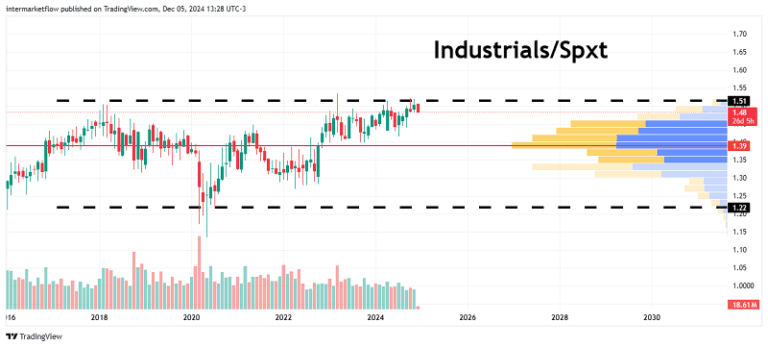
This could be an option for an aggressively defensive trade. Shorting weak industries.
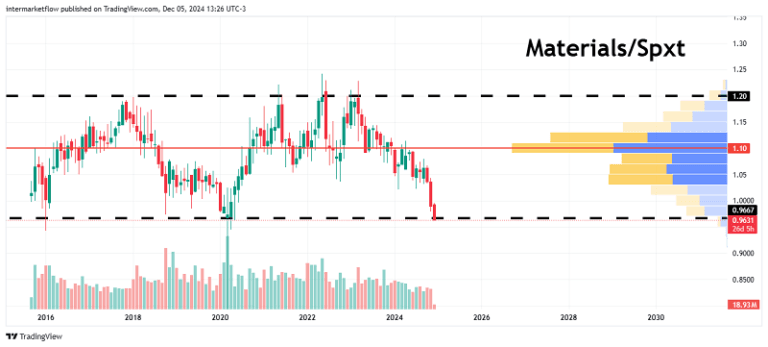
Materials Sector = Prices have already been corrected.
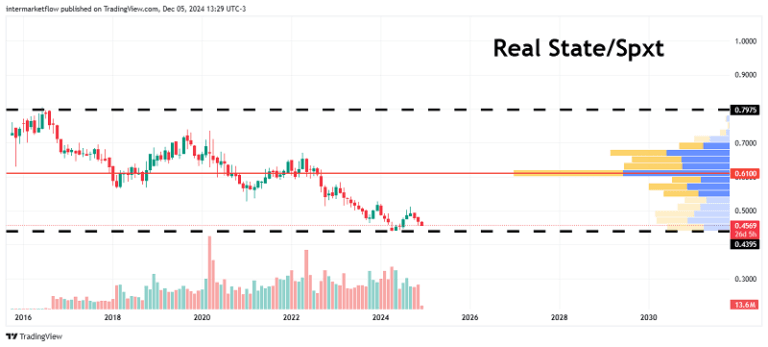
Real Estate Sector = Prices have already corrected.
Health Care Sector = Opportunity.
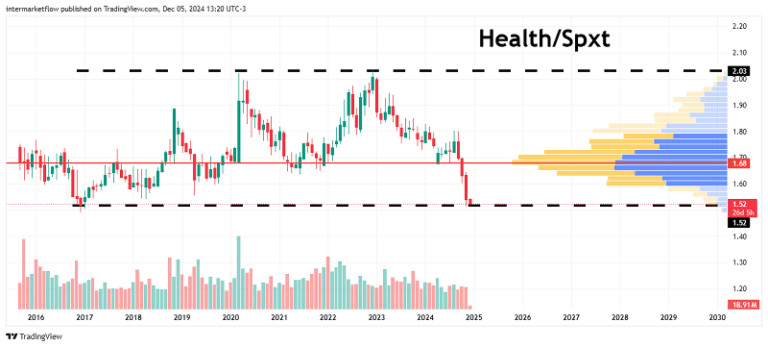
This would be a trade positioned halfway between defensive and aggressively defensive. It’s a sector that is relatively cheap compared to others in the economy and inherently defensive. In a capital rotation, it could be an option, especially in a scenario that is neither a soft nor a catastrophic landing.
The Vehicle:
In this particular situation, everything depends on each individual’s risk tolerance. Regardless of the trade itself, it can be executed with simple ETFs, inverse ETFs, leveraged ETFs or options.
We’re exploring vehicles in the industrial and healthcare sectors. We haven’t yet determined the level of aggressiveness we want to apply to the trade, which is why we haven’t sent it out.
As always, there are many options. What we do know is that it’s time for a defensive portfolio: very limited upside and significant downside potential.
We’re receiving several private messages. Apologies for the delays—we’ll respond as best we can.
Stay in touch,
Martin
Intermarketflow.com
- Intermarketflow