Intermarket Analysis Throught Macro and Technical Methods
#25 Trading Real Rates.
Trading Developed Western Economies: Currencies and Equity Through Real Interest Rates
Introduction
We relate currency analysis to equities in Western developed countries. In this
case, we’ll look at real interest rates of the major global economies to infer strengths and weaknesses for each one.
Understanding the Concept of Nominal and Real Interest Rates
The macro identity we reviewed here establish:
Nominal Rates = Real Rates + Inflation Expectations + Term Premium
By playing with this identity, we can infer that:
Real Rates + Term Premium = Nominal Rates – Inflation Expectations.
Importance of Inflation Expectations in Trading
Of course, this will give us a snapshot of today’s real rates. This photo is part of a never-ending movie that’s in constant change and doesn’t capture the rate of change in the underlying variables. In other words, it has a lot of technical limitations. Despite this, we can still use it to infer useful information. A valid analogy would be comparing it to an annual report for a company.
We contrast this information against the currency and main stock index of each country, all under the lens of our primary U.S. macro view, discussed several times. We add to this macro view our conclusion from the previous article, which can be summarized in the following chart:
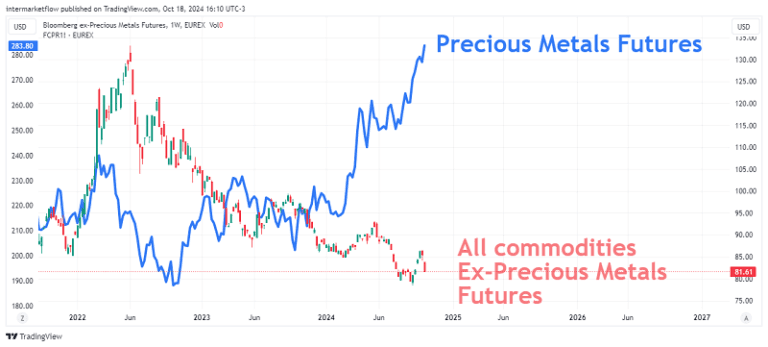
These are the commodity future prices the market expects for commodities in March 2025, as we reviewed here. In that article, we broke down futures for Energy, Industrial Metals, and Grains. They all convey the same message: the world is currently expecting an economic slowdown by March 2025, which is reflected through prices.
It’s also true that the future price of precious metals adds a postscript to this message: there is uncertainty and risk aversion. The level of uncertainty of this aversion can be mesured by the opportunity cost of gold.
We can infer this to be today in this way.

That’s the real opportunity cost of gold today: 2.13%.
Before continuing, some methodological notes:
1. We calculate the monthly real interest rate using each country’s current Central Bank lending rates minus each country’s monthly inflation expectations.
2. We assume that the term premium is constant across all countries. This is, of course, an unrealistic assumption. Unfortunately, to analyze and compare the evolution of a specific variable, it’s necessary to establish ceteris paribus across countries. Otherwise, comparison becomes impossible. (Term Premium = the extra return required for investing in a 10-year bond instead of investing 10 times in a 1-year bond.)
3. We use each country’s inflation expectations, in monthly format where available. For those countries that don’t publish this information, we use the most recent monthly CPI data to calculate real rates.
Let’s begin.
Real Interest Rates and the S&P 500 Behind the Scenes
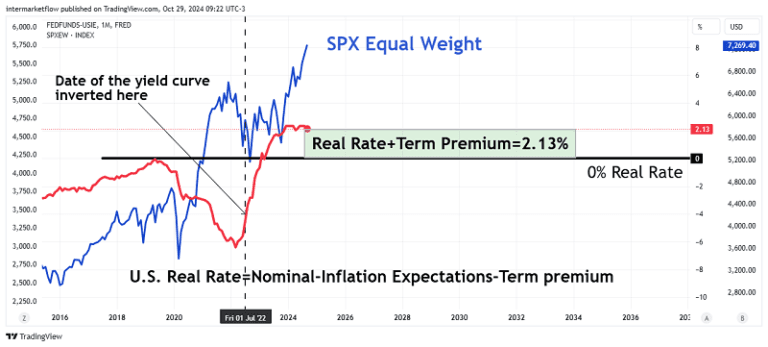
Us Real Rates and the U.S dollar
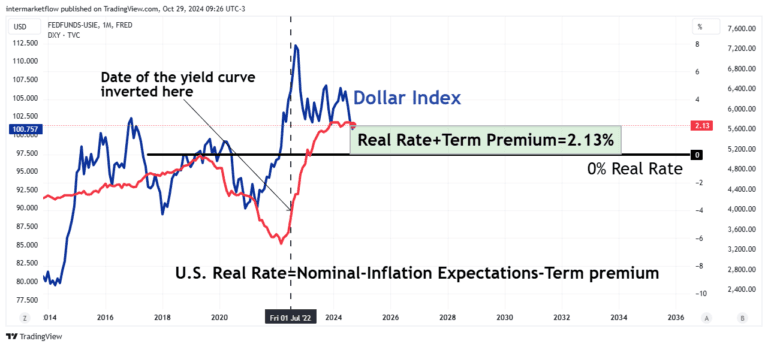
These charts, without surrounding context, would suggest a healthy economy. We’ve already seen that when you dig deeper, this isn’t the case. Despite this, the currency responds to the real rate, and the S&P Equal Weight is skyrocketing.
Trading Strategy
Real Interest Rates and the S&P 500 Behind the Scenes
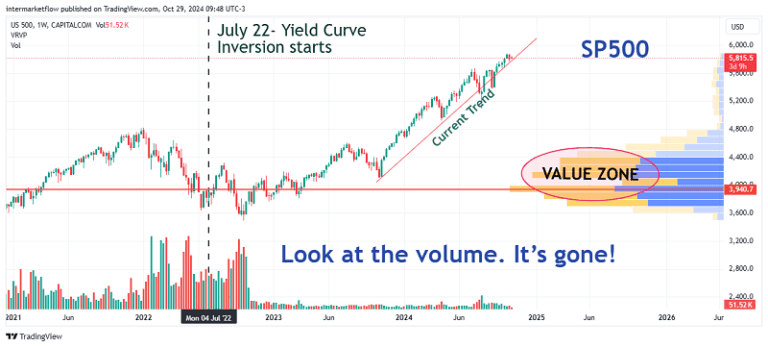
Alright, let’s read this chart:
- Volume has literally disappeared since November ’22. Analysts call these recent entries “stupid money.” However, so far, the “stupid” investors are doing quite well. For those of us who love and respect technical analysis and have a well-argued, solid macro view, well…it makes us anxious. The correction feels imminent.
- The value zone the market sees, completely independent of our analysis, is now so far off that the risk/reward (P/L) of shorting the S&P 500 is enormous.
- The current trend is constantly being tested.
This market shows extreme weakness. Few buyers are entering, and they’re dwindling, yet sellers haven’t appeared. The stage is set for a stampede. However, trying to catch the peak is risky—there could be plenty of “stupid” investors, and the stampede might take time. Furthermore, the S&P 500, in particular, attracts funds from around the world, making it more resilient than other indices. Of course, there are also the “Magnificent 7” stocks that distort the entire index.

Strategies for Successful Rate Trading: Euro zone.
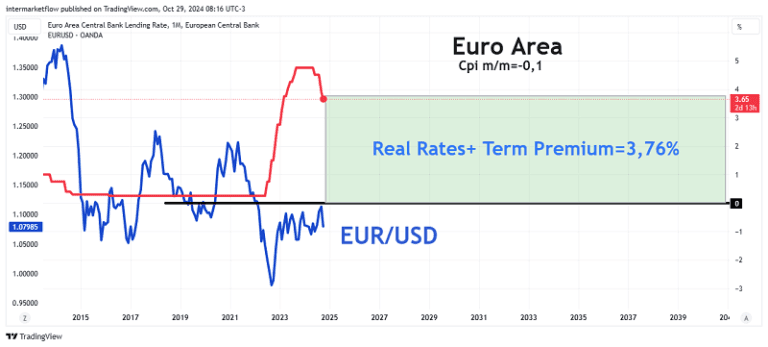
The Euro responds to the rise in real rates, but to a much lesser extent than the Dollar, for example. This is already a warning sign regarding real growth expectations in the Euro zone.
Eurozone Real Rates and EU50.

Real Rates, EU50 details.

The situation is very similar, though not as extreme. One key difference is that these are the 50 largest companies in Europe, which don’t include the “Magnificent 7,” unlike the 500 in the U.S. S&P, which do include them. If we expanded the sample, the situation would change.
Real Rates and the DAX

Dax
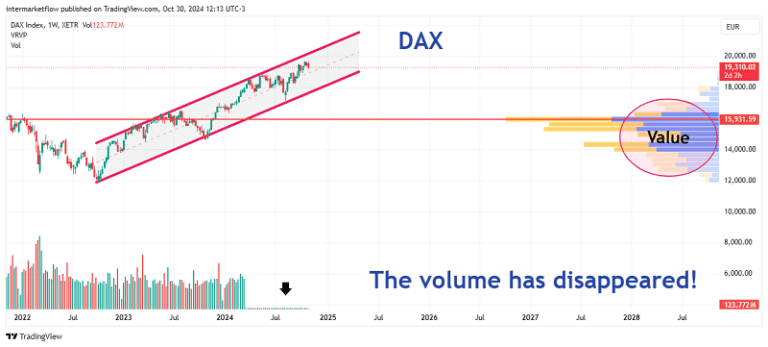
It’s a very similar situation to the S&P 500 and EU50. Prices are rising without volume
support, moving outside the value zone and even reaching the upper part of the channel.
This is another fragile scenario.
Real Interest Rates and the British Pound.

The pound responds to positive interest rates but not in the same proportion, which is a warning sign.
Real Interest Rates and the FTSE.

The index begins to rise even before the real interest rates increase. Let’s dig into the market details.

Same story. Lack of volume. Unsustainable.
Real Interest Rates in Asia-China Real Rates and the Yuan.

These two variables lack connection. The Yuan/USD volatility shows no relation to China’s real interest rates. This is a clear sign of distrust in the currency and, therefore, in real growth expectations for China.
Real Rates and the CSI300

This market is much more in touch with reality. Volume is present, and the index, which was trending downward, reacts strongly to the recent economic measures announced.
Conclusions: Real Interest Rates and Western Markets
- The pattern repeats with varying intensities across Western developed countries, especially in Europe, where currencies are weak relative to the U.S. dollar.
- The developed Western markets, namely the U.S., Eurozone, Germany, and England, are showing a similar pattern: all are trending upward with a divergence in volume. Technically, this is unsustainable and persists only due to the lack of sellers. Eventually, these sellers will appear, either from profit-taking, a natural market correction, or a combination of both. With so few buyers, a correction becomes inevitable. Additionally, the current overextension poses an extra risk, exposing the market to a correction larger than usual.
- This isn’t the case in China, where the market was in a real negative trend until the recent economic stimulus announcements by the Chinese government. Most importantly, all of this is happening with volume, providing a clearer reflection of the market’s state.
Set ups, Real Rates and Equity Market.
Intermarket analysis, once again, shows us the bigger picture. It’s no longer just about going short or long on a stock, a market, a bond, or a commodity. A global perspective lets you understand what’s happening and opens up options to choose a vehicle you might not have considered.
Real Rates, Nature, Its Lessons, and the Choice of Prey
Whenever I can, I enjoy watching Animal Planet. It always amazes me to see a pride of lions hunting deer, zebras, buffaloes, giraffes, and even elephants. This perfect killing machine is constantly seeking the vehicle that will allow it to eat.
Despite their superior strength, they systematically seek weakness in their prey. From the largest to the smallest, the pride instinctively selects the weakest prey, whether due to illness, age, or size. Nature is wise and markets instinctively act in the same way.
Real Rates and Choosing the Right Vehicle.
Based on our macro view and inferences from the commodities market, we have been and are still looking for vehicles that allow us to trade a slowdown, not just in the U.S. but globally. We must carefully choose one or several targets.
The full setup can be found in article #26, here in this same blog.
As always, I hope you enjoyed this as much as I did writing it
That’s all for now. Please share this. The subscription won’t cost you anything and it makes our day. You can find us at intermarketflow.com and on X @intermarketflow.
Stay in touch,
Martin
Intermarketflow.com
- Intermarketflow