Intermarket Analysis Throught Macro and Technical Methods
#22 Set-ups: Trading a Short-Term Rate Drop Amid a Recession in the United States.
The eventual recessionary state in the United States (and potentially China) makes it infeasible to consider commodities sensitive to this situation, such as oil in the Set-up.
Options:
Intermarket-Macroview:
We operate based on our hypothesis:
- We know that short-term rates will fall further and faster than long-term rates.
- The starting point is a scenario where money markets are flooded with dollars.
This sets off the chain effect that Intermarket Analysis determines. Despite its lags and changes in correlation (as we discussed here), it provides a clear guide that anticipates
where the capital will land next. (This analysis assumes no systemic shock will occur).We are looking for currencies exposed to commodities. They provide a hedge against potential dollar weakness.

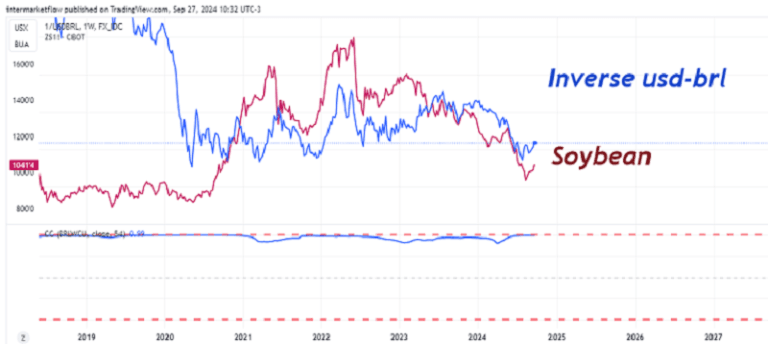
When trading in emerging markets, you have the option to either take on exposure to the local currency or avoid it. In this case, we will analyze a Brazilian sovereign bond denominated in dollars. The rationale behind this is our belief that any future weakness in the dollar will lead to an increase in the price of soybeans in dollar terms.
This scenario will improve the current account and the country’s risk profile, leading to an appreciation of the bond price. Moreover, trading it this way aligns better with the “risk-off” stance that prevails in the market.
Inflation trends are similar in all three countries, and as of today, September 27, 2024, the Brazilian bond offers a yield of 12.2%.
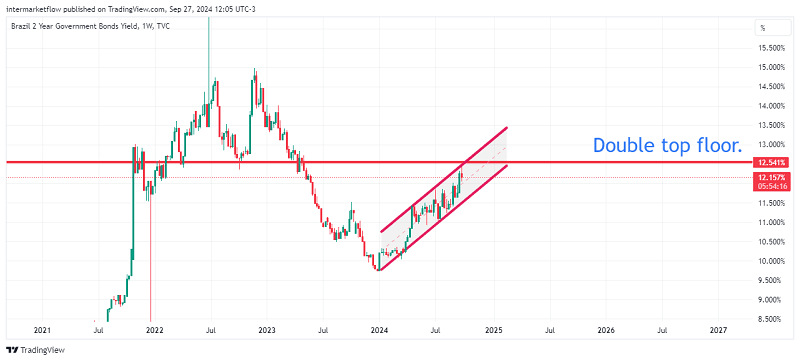
Technical Set-up: 2-Year Brazilian Bond Yield for a Global Bond.
Trend.
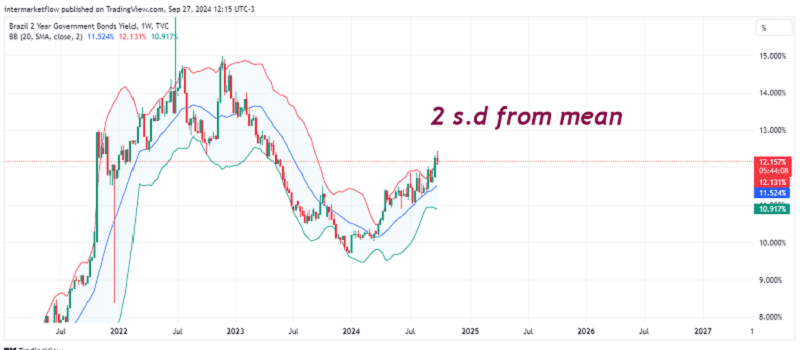
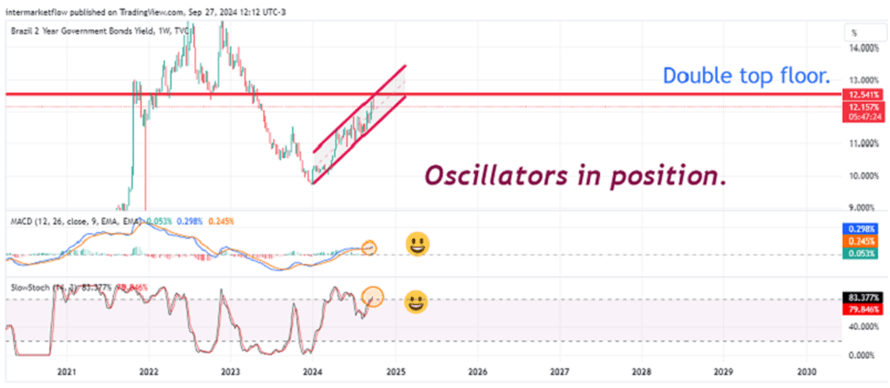
Mean Reversion-Position within the trend-Extreme overextended.
Trend Reversion.
Of course, this set-up doesn’t have the usual technical depth. It’s a trade based on Intermarket and Macroeconomic Analysis. In our portfolio, this position has a different time horizon than usual.
For legal reasons, I am obliged to repeat in each article:
These are NOT trade recommendations. This is what we are doing ourselves, shared for marketing purposes.
As always, I hope you enjoyed this as much as I did writing it.
That’s all for now.
Please share this. The subscription won’t cost you anything and it makes our day.
You can find us at intermarketflow.com and on X intermarketflow.
See you soon,
Martin
Intermarketflow.com
- Intermarketflow