Inflation Expectations and the Shattering of the Disinflationary Narrative

When facing a multiple-choice question, it can sometimes be useful to eliminate the most implausible options first.
Equity Flows
The technical evidence suggests that capital is reducing exposure to equities, particularly in sectors most sensitive to interest rates.
This is not yet a systemic capitulation yet, but rather a repositioning phase triggered by the repricing of the yield curve.
Staples
The Staples chart reveals a violent correction. High sensitivity setor to rates.

In this context, the liquidation of consumer staples reflects the unwinding of duration-sensitive not defensive positioning for a slowing economy.
Home Builders

The sector has breached the psychological $100.00 level, confirming that the “Higher for Longer” reality is now the primary engine of destruction. Yield curve repricing hits hard in this already vulnerable sector.
Financials

Beyond the emerging stress in private credit, banks also face:
- Unrealized accounting losses on rates differentials subject to yield curve repricing.
- Rising delinquencies across every type of credit. Consumer, Personal, Mortgages, Commercials or not, small-business, student loans and even farms delinquencies at record highs. These risks remain structural but not yet systemic.
We’ve written about this, the financial situation of four of the six big banks, publicly disclosing their names, as well their exposure since September 25. You can see this here
The leverage ETF segment position into the weekend (x3 etfs)

The leveraged most traded ETFs for the week are showing extremely elevated activity, largely dominated by inverse instruments.
- SPXS – short exposure to the S&P 500.
- TZA – short exposure to the Russell 2000.
- EDZ – short exposure to Emerging Markets.
- WTID – short exposure to Crude Oil (contrarian trade based on statistical deviations of mean reversion).
- SOXS – short exposure to the Semiconductor sector.
- KORU – leveraged exposure to the South Korean equity market.
- NAIL – leveraged exposure to U.S. homebuilders, again a contrarian trade looking for a rebound based on last move extension.
- TYO – leveraged exposure to U.S 10 years yields.
The Master Signal: LQD/HYG Ratio

Technical Execution: The LQD/HYG Wedge Breakout
When the ratio exits the triangle to the upside, it triggers a “Flight to Quality” signal that overrides standard equity momentum. This is the technical roadmap for that event:
- A breakout above the descending trendline (currently near 1.385) confirms that the market is aggressively pricing in a Hard Landing. Capital is no longer just “rotating” it is fleeing junk debt (HYG) in favor of senior, high-grade collateral (LQD).
- Systemic Equity Capitulation: This technical break typically serves as the “lead-in” to a SPY correction. As the ratio climbs, the cost of capital for lower-tier companies becomes prohibitive, forcing a repricing of equity valuations based on insolvency risk rather than growth
The “June 26” Pressure Cooker. The deadline acts as a timing threshold. An early breakout (before June) indicates that institutional players are front-running a systemic event.
Credit Complacency
The smart money is exiting duration (rates) but staying in credit (spreads). As long as Junk Bonds hold, the market is signaling it does not expect an immediate wave of corporate bankruptcies.
The same analysis, using different variables.

Today (2026) – ~300 bps: credit markets relatively calm, no systemic stress priced. For a direct comparison, 2007 (Pre-GFC) – ~250 bps: extremely loose credit conditions, risk was underpriced.
This reflects the compression we see in the wedge between LQD and HYG.
Crude Oil: The Variable of Chaos
Its current price—and second round effects it could have on inflation—are generating growing uncertainty, something clearly reflected in the bond market.
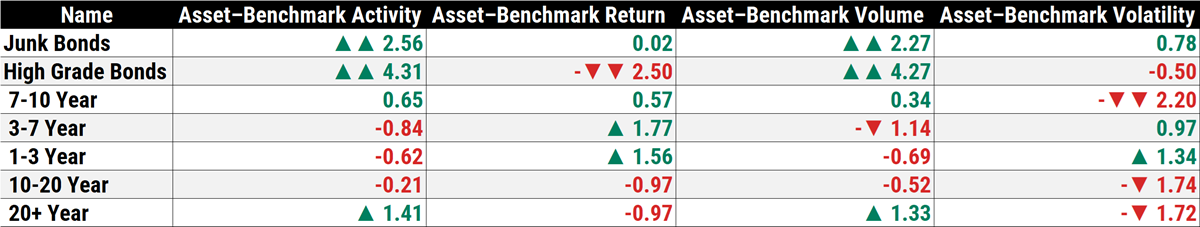
Bond market movements over the past week.
It is important to highlight that liquidity was concentrated in high-quality assets, before starting this analysis.
That is precisely why we are seeing the kind of exit now unfolding.
The latest PCE, CPI, and crude oil data have forced the market to reassess inflation expectations—and therefore the path of interest rates.
High Grade Bonds
Activity: ▲▲ 4.3𝞼 deviations is a statistical black swan
Volume: ▲▲ 4.27𝞼 deviations is a statistical blackswan
Return: ▼ -2.50𝞼 near-threshold tail event.
Junk Bonds
Activity: ▲▲ 2.56
Volume: ▲▲ 2.27
Return: neutral
Interpretation
There is heavy trading activity and strong flows, but without positive returns. This signals distribution or repositioning, not accumulation.In other words a lot of movement, but nobody wants to hold the asset, HYG
Yield curve repricing: Higher for Longer
If CPI, PCE, and PPI and Crude do not show signs of decelerating, the market begins to price in:
- fewer rate cuts
- cuts coming later
- or even a full pause
Consequence
- Selling in long duration
- Flows moving toward the short end of the curve
Markets Validation for the week
This hypothesis is supported by the interest rate futures market.

Conclusions and Trading Opportunities
The CME FedWatch confirms the bond market’s message: rate cuts are being priced out. Probabilities remain anchored in the 350–375 bps range, pushing the easing cycle further into the horizon.
The Tactical Playbook
- Equities: Maintain a Zero Equity Bias. Do not chase “dead cat bounces” the institutional momentum is purely bearish.
- Credit: Watch the 1.37 LQD/HYG floor. If it breaks upward before June, the capitulation in the SPY will be violent.
- Bonds: Avoid. The duration paradox is still liquidating the front and middle of the curve.
- Gold: Early yet, but once the market accepts that rates cannot rise fast enough to suppress sticky inflation, capital will rotate from the “Cash safety” of the dollar into the “Hard safety” of Gold.
Macro Regime: We have moved from a disinflationary trap to an Inflationary, No-Growth environment.
If you believe this is an error, please contact the administrator.