Yen Carry Trade
- The origin of the Yen Carry Trade — why it happens.
- How the trade is built and the costs involved.
- The different carry trade structures that can be set up.
- The difference between players who hedge FX risk and those who don’t.
- Which part of the yield curve each player operates in.
- Intermarket forces are always at play—nothing moves in isolation. Capital markets are all interconnected.
- Conclusions.
- Technical volume analysis in its different forms, and why this will crash hard when the madness ends.
- Statistical analysis
- Intermarket rules: the message from bonds, commodities, and equities.
- Following the money.
- Final conclusions.
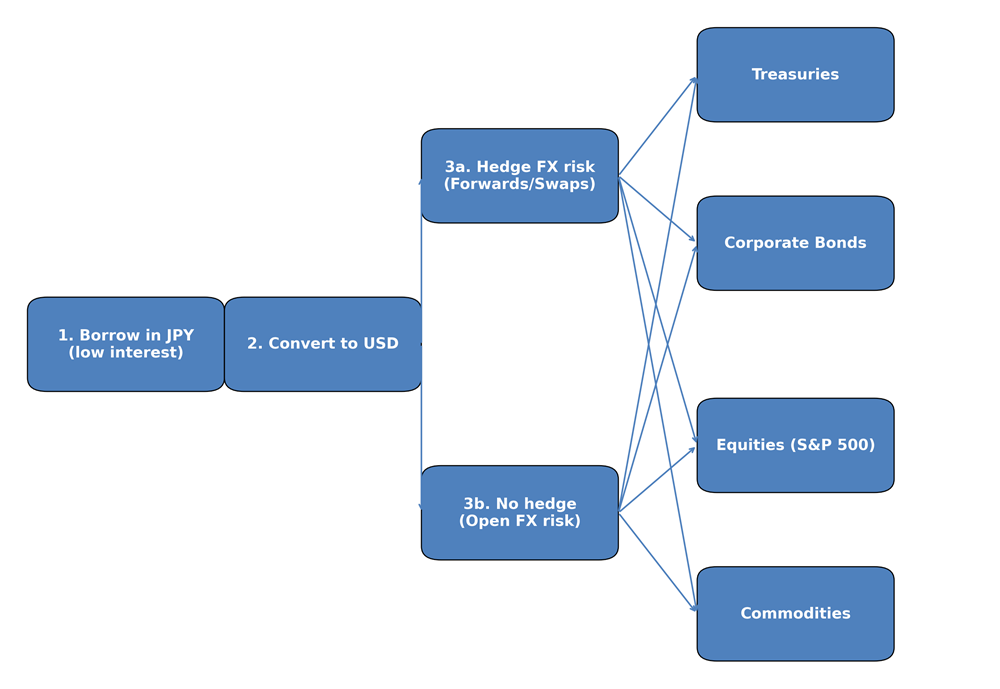
Yen Carry Trade: How It Builds and Unwinds
- Borrow in JPY at near-zero rates.
- Convert to USD and buy higher-yield assets.
- Hedge or leave FX risk open.
- Unwind: sell assets, reconvert to JPY, repay loan.
Two Types of Carry Trades
- Hedged: FX risk is eliminated at t=0. The hedge locks in the current rate differential, so the bet is purely on how interest rates evolve between the two currencies over the investment horizon. Since entry and hedge occur simultaneously, this trade does not drive the USD/JPY exchange rate.
- Unhedged: FX risk is left open. Returns depend on both the rate differential and the currency move during the life of the trade. This format strongly impacts USD/JPY, as flows occur at entry and later at exit, when the FX level is different and flows are directional.
Yen Carry Trade and Duration
These trades can be built anywhere along the yield curve, regardless of maturity. The decision hinges on how rate differentials evolve across different tenors
Yen Carry Trade: The Skeleton
Yen Carry Trade: Risk and Return
Profit = (i_high – i_low) + ΔFX – Hedging Cost – Setup/Unwinding Costs
Where setup and unwinding costs are the fees paid along the way: the lending bank, the FX broker, the hedge execution, and the commissions tied to investing in the asset.
Each carries trade’s risk—and therefore its return—depends on who is running it and their objectives. As you can see, potential investments differ both in yield and in risk.
Yen Carry Trades: The Players and Their Usual Trade Forms
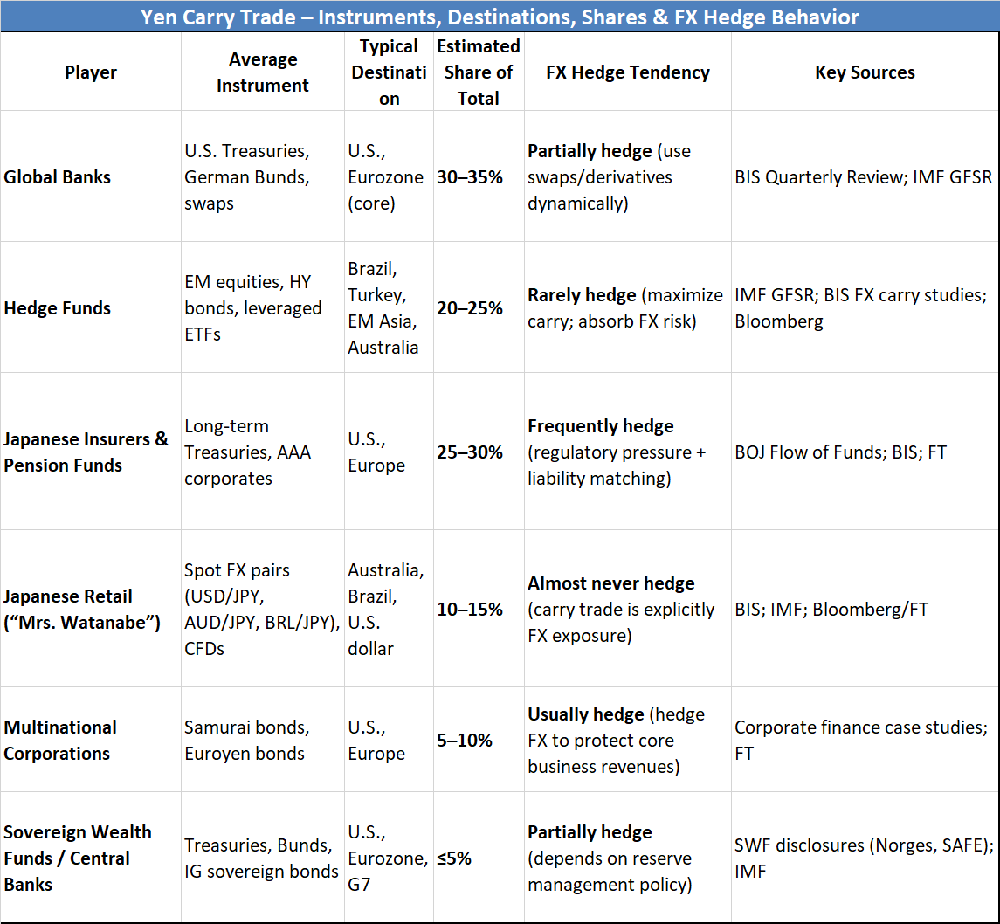
As you can see, the yen carry trade can take many forms. In some cases, a simple rate move can trigger an unwinding, while in others it barely matters. Do notice that around 55% and 65% of total volume is made through big institutions with high risk aversion, hence U.S. treasuries is a very common destination. In fact, Japan is the largest foreign holder of the U.S. Treasuries, with over $1 trillion in holdings.
Yen Carry Trade: Current Levels and Trends of Key Variables
As in all economics, each variable has both a current level and a trend.
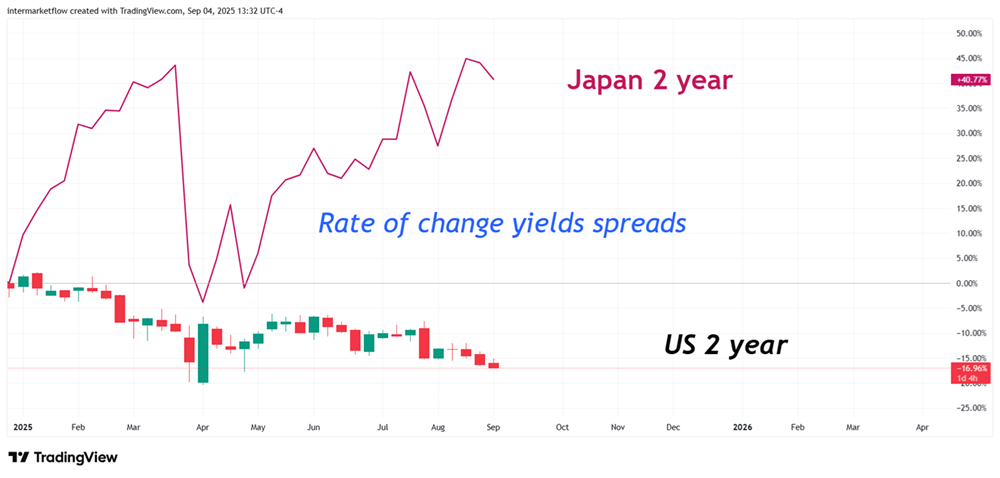
2-Year Rates — Level and Trend
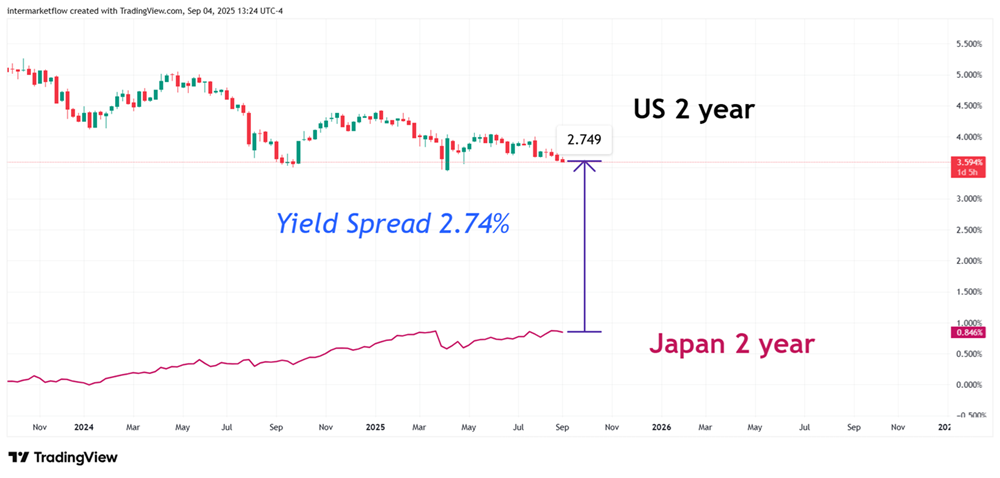
Rate Differential Today
Above: current spread.
Below: the present trend of both rates.
Looking ahead, what trend should we expect? For now, as of September 17, the market has already priced in a 25 bp cut in the spot rate, which—given the short horizon—directly impacts the 2-year yield. As I write, after the Non-Farm Payroll release, markets are starting to price a 50 bp cut with a 15% probability.
Yen Carry Trade on a 10-Year Horizon
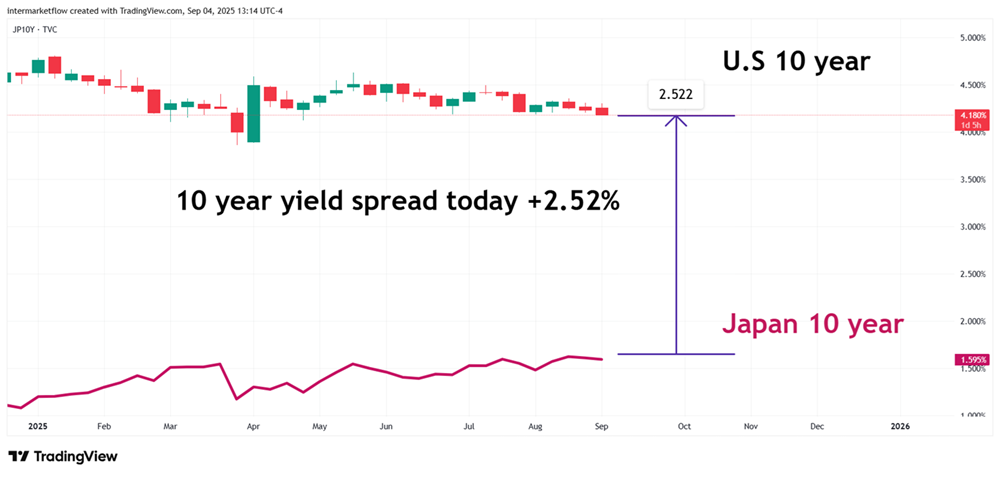
Again: Current Levels and Underlying Trends
For the 10-year yield, the Fed’s control through the spot reference rate is limited. Absent other type interventions, 10 year yields reflects pure market expectations about the real economy.
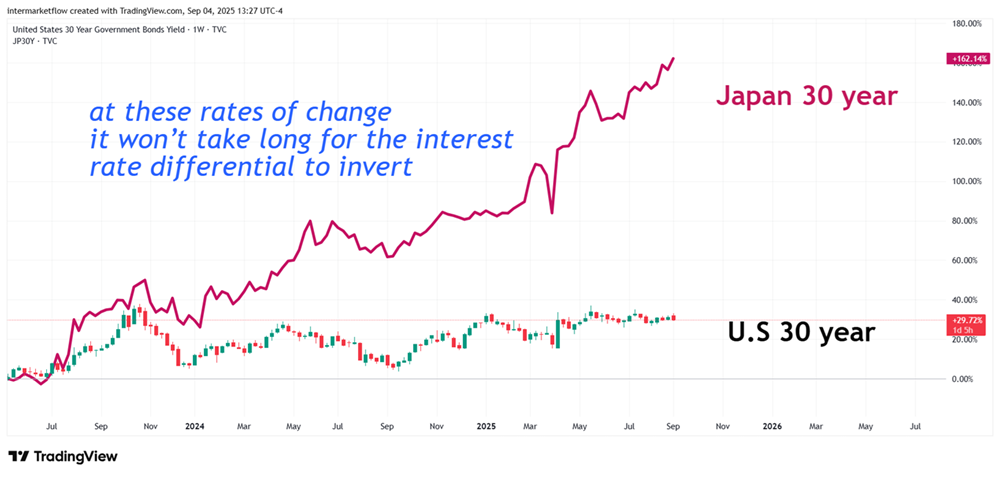
Yen Carry Trade on a 30-Year Horizon
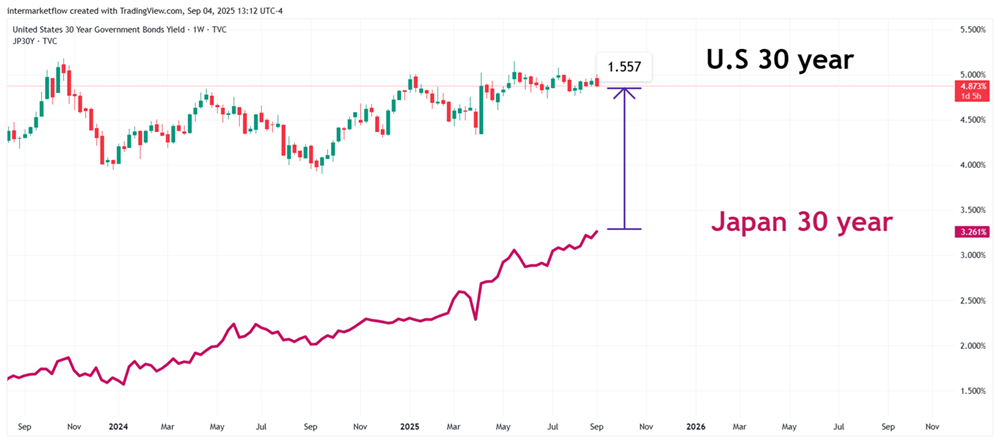

Again: Current Levels and Trends of Both Rates
Below: recent moves in Japan’s 30-year yield, where long-term inflation expectations seem to have spiked—pushing the rate higher. This has serious consequences for Japan and potentially for the U.S. and the rest of the world.
Yen Carry Trade unwind: Two types of exit and consequences
If nothing changes at one or both ends, a clash seems inevitable. It’s not a single level that triggers the unwind.
- Roughly 60% of these trades are held by large, risk-averse players for whom the rate differential is decisive. When they exit, the impact shows up in Treasury prices—and therefore in yields—but not in the exchange rate, since that FX exposure was hedged at t=0.
- For the rest, returns depend less on the spread and more on asset performance and, of course, FX. Historically, the yen has been seen as a safe haven. Looking back, its sharp appreciation often came from the unwinding of unhedged carry trades. When that happens, it’s hedge funds pulling back.
Yen Carry Trades: Relevant variables value
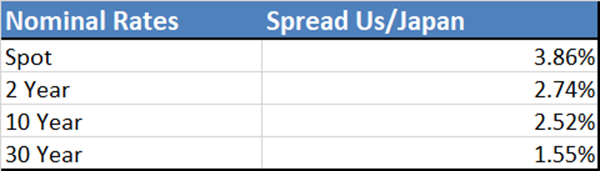
Yen Carry Trade: Observations Big Players
The most exposed part of the curve is the 30-year segment, where pension funds and large banks operate. Note that today the spread is just 1.55%, and remember there are unwinding costs we haven’t quantified: selling assets, buying yen, and returning home to whatever asset they choose to park in.
Yen Carry Trade: Other Players
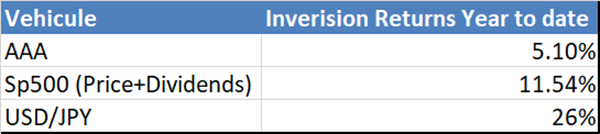
It’s hard to tell if these trades are in profit or loss without knowing their starting point or the initial FX level. What we do know is that the dollar gained 26% against the yen over the past year, a huge tailwind. They’ll need fewer dollars to repay their yen debt. Add a solid S&P 500 return, and despite the shrinking rate spread, the trade stays highly profitable as long as other variables remain favorable.
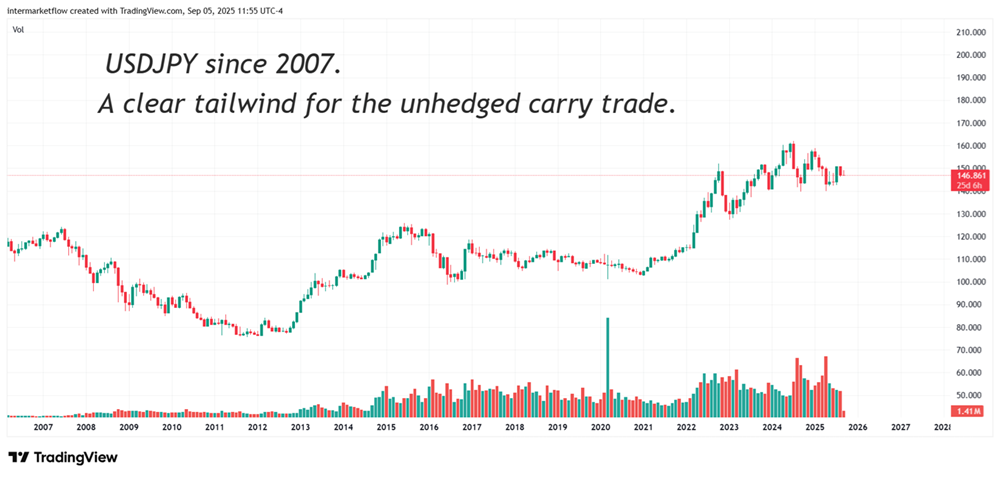
Yen Carry Trade: USD/YEN
Conclusions
- The most exposed segment is the 30-year, where banks and pension funds operate. Remember, 60% approx of the volume here. The break-even point for these players shouldn’t be far. With today’s 1.55% spread—and unwinding costs still to be factored in—they’re running out of margin.
- These players hedge FX risk, so the exchange rate does not affect them.
- The rest—those who don’t hedge—benefit from the yen’s ongoing depreciation.
- For them, the rate differential is not the key driver.
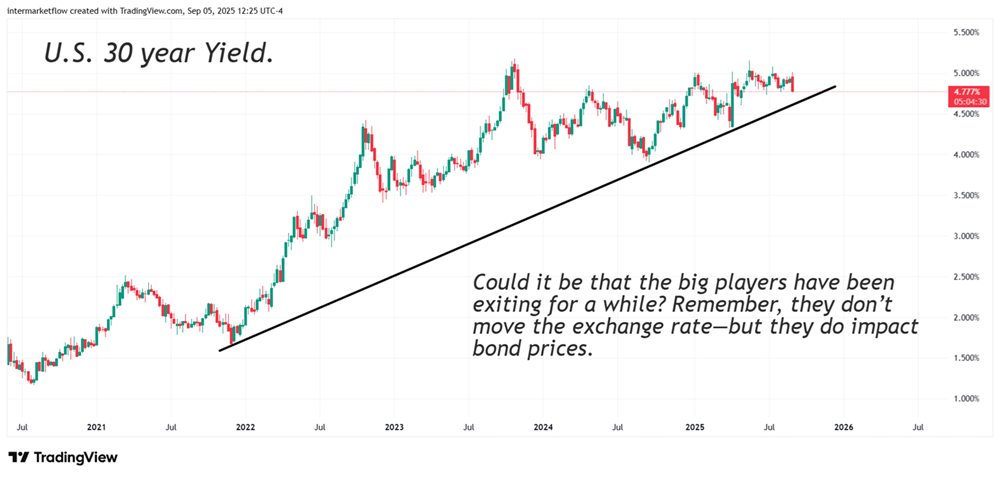
- We’ll know big banks are unwinding when Treasury prices fall.
- We’ll know hedge funds are unwinding when the yen abruptly appreciates against the dollar.
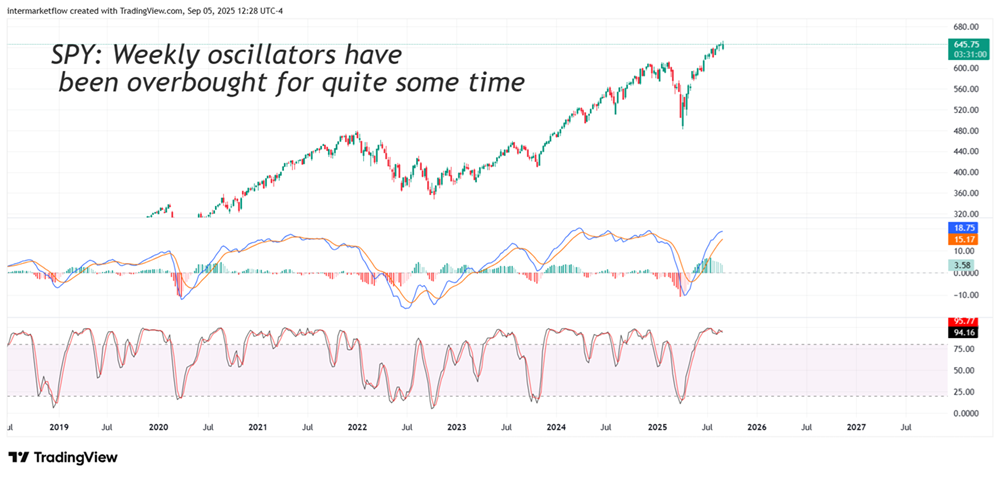
Technical Analysis: SPY from a volume perspective.
It makes no sense to analyze trends or momentum. The only thing that matters now is how many miles are left to run.
On Balance volume
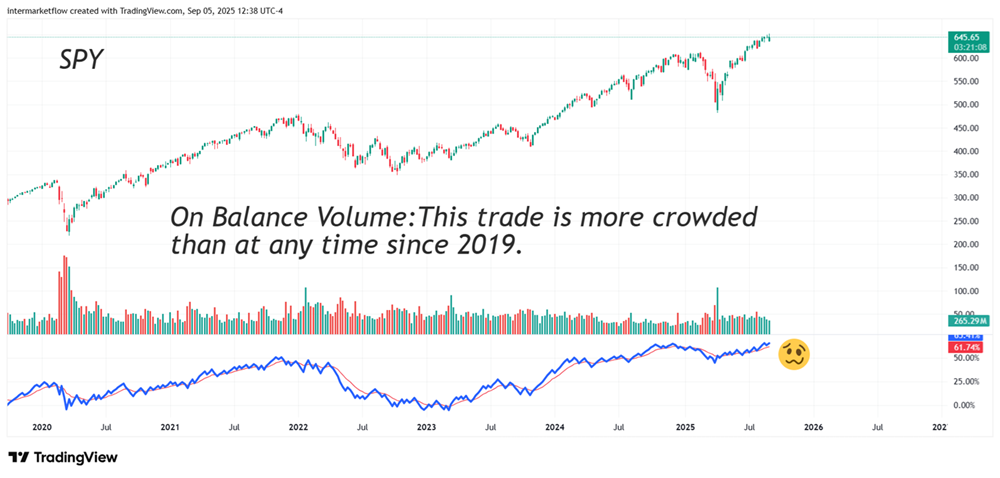
On-balance volume
Keeps rising, but at a slowing pace. Along with a small bearish divergence, this shows few new entrants. Still, they’re all bullish. And if you look at the OBV level, this trade has never been so crowded since, at least, 2019.
The market can stay irrational longer than… yes, but when the madness fades, it will drop like a stone. A very big stone.
Periodic Volume Price
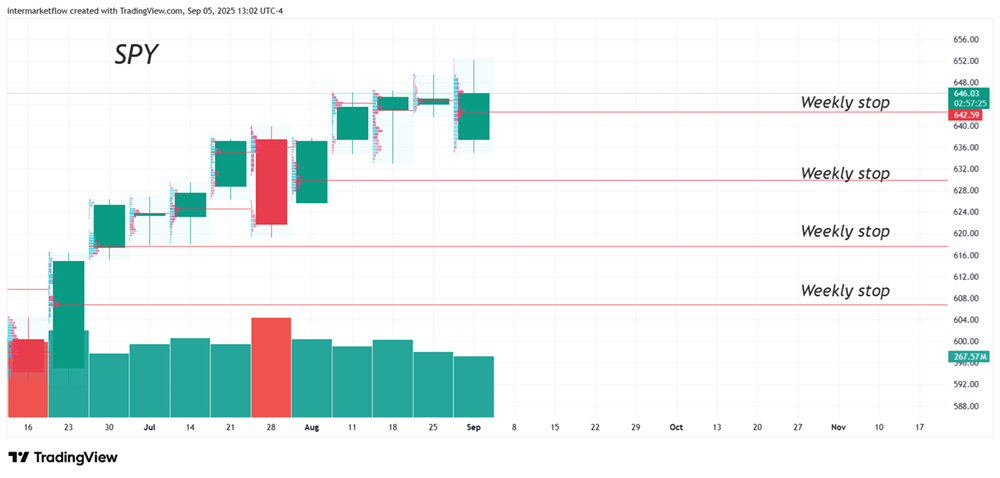
The red lines mark equilibrium prices—or the most liquid levels—from past weeks. Once broken, they disappear. They often act as support or resistance, simply because of their track record.
Statistical Analysis
With Friday’s closing prices, post nonfarm payrolls, the market reacted as follows regarding the path of interest rates in the upcoming meetings.
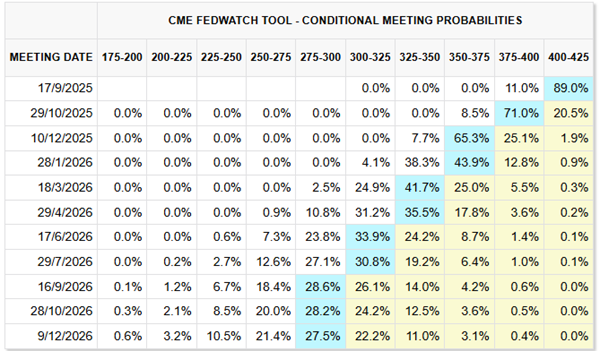
On the Y-axis we have the dates of the upcoming Fed meetings. On the X-axis, shown at the top of the chart, we have the probabilities regarding how rate cuts will proceed in the upcoming meetings.
The cut at the next meeting is practically priced in with an 89% probability. At the following meeting on October 29, another 25 bps cut is expected with a 71% probability, and at the next one on December 10, another cut with a 65% probability. This is the rate path the market is pricing in through year-end. Of course, three consecutive cuts affect different asset classes in different ways.
Let’s see how aligned the intermarket is with this scenario
We are trying to follow the flow of money from the week and see if it is consistent with what happened on Friday.
Winners for the week
They are ranked from highest to lowest according to the weekly return Z-score. Remember, this number allows us to compare them against each other. (If you need a refresher on the Z-score, you can check it here).
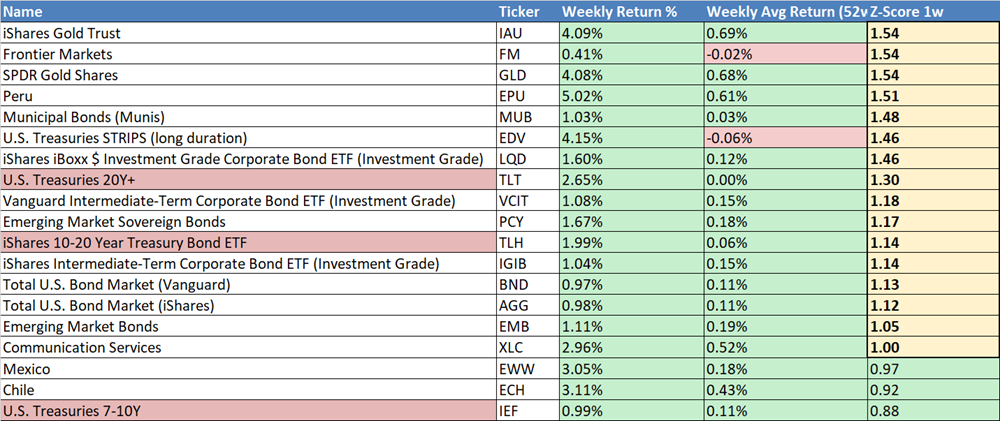
The Z-scores highlighted in yellow reflect strong moves. Remember, as we get closer to 2, the move becomes more extreme.
What stands out is the rally in the middle and long end of the curve. Normally, one would expect short-term bonds to rise more. So the key question is: why didn’t they?
Three short-term rate cuts trigger declines in 10-, 20-, and 30-year yields. What’s happening here? Did inflation expectations and the term premium fall? I don’t think so. Rather, I interpret it as a drop in real yields at 10, 20, and 30 years—which is the same as saying the real economy is weakening over those horizons.
Going Deeper

Rate cuts should boost risk-taking, but flows moved sharply into quality instead. Returns don’t show the full picture—Z-scores reveal that moves in high-quality assets were unusually large, nearing extreme levels.
In the bond market we see another inconsistency—or at least not the message we would like. Quite the opposite, in fact. The bond market is defensive and pessimistic about the economy at the long end of the curve.
Commodities speak as well
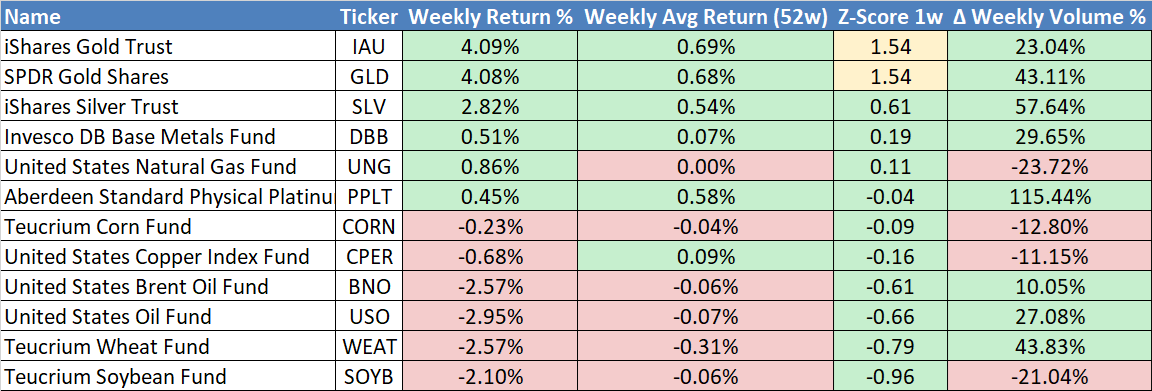
First, gold and silver posted returns close to extreme levels, supported by volume. This trend looks healthy.
It’s not a good sign to see oil and copper at the bottom of the table in a scenario of three consecutive rate cuts. These prices don’t speak exclusively about the U.S., but as the world’s leading power, the U.S. is certainly included.
Equities speak too
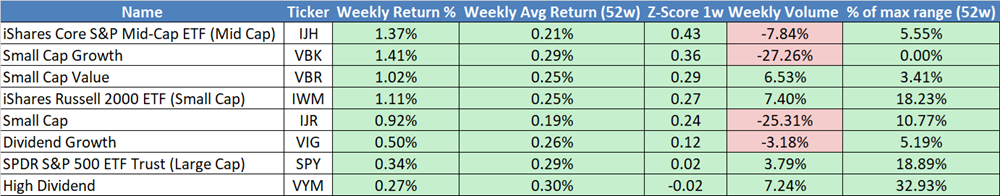
These were the week’s winners. They all share the same profile: Risk On. But when you break it down, the picture is different. They managed positive returns, yet almost all with falling volume. In technical analysis, this is called bearish divergence. To make matters worse, look at their volume percentile—minimal, declining, and paired with positive returns. Few are entering, fewer each time, but for now they’re going long. We’ve seen this movie before: a simple round of profit-taking and the picture changes. This trend is the opposite of a healthy one.
Conclusions:
- We saw clear reactions in bonds and commodities.
- They’re not the ones we’d like to see, but they are what they are.
- Equities continue their path, but despite three cuts that should support them, gains are marked by divergence and minimal volume.
See you next Sunday, God willing.
Martin
If you believe this is an error, please contact the administrator.