Executive summary.
Unemployment and Macro sectors
- A historical and current perspective on unemployment
- The evolution of the economy’s sectors across 1, 2, and 3-month time windows
- The decoupled sectors and what we consider opportunities
- The identification of the vehicle. Why? When?
- What kind of trade is it? Mean reversion or the search for a top? What changes?
- Full Technical setup—this time we include a few notes on the triggers.
Unemployment, Macro Cycles and Sectors.
Unemployment is a complex variable that really deserves more than one article on its own. It has many angles, and given its importance, it’s not something to discuss lightly. In upcoming pieces, we’ll go deeper into it — but for illustrative purposes, I just wanted to show you this chart to give you a broader perspective.

The gray shaded areas represent all recessions going back to 1972. As we’ve discussed, rising unemployment is primarily a coincident indicator of recessions. The reason is that layoffs tend to be the final stage in a company’s adjustment process. Firms cut hours gradually, try to stretch things out and make other reductions first. Of course, that process varies widely between labor-intensive and capital-intensive businesses — and even across sectors.
I wanted to convey a historical perspective — how the variable behaved ahead of past recessions, and where current levels and trends stand today. Clearly, the situation is on the edge — not only because of the level, but mainly because of the trend.
Unemployment, macro cycles, and sectors.
Since this is the mid-week report, I don’t want us to drift away from the technical side. One solid way to identify macro cycles, of course, is by tracking the different sectors of the economy. Weekly monitoring matters, but this time we’re going to break it down into 3-, 2-, and 1-month windows to gain perspective.
Unemployment and sectors: A movie in three frames
We’re going to move from the higher timeframe to the lower one. In this case, a 12-week moving average — meaning one full week comes in and the oldest week drops off, rolling over 12-week periods.
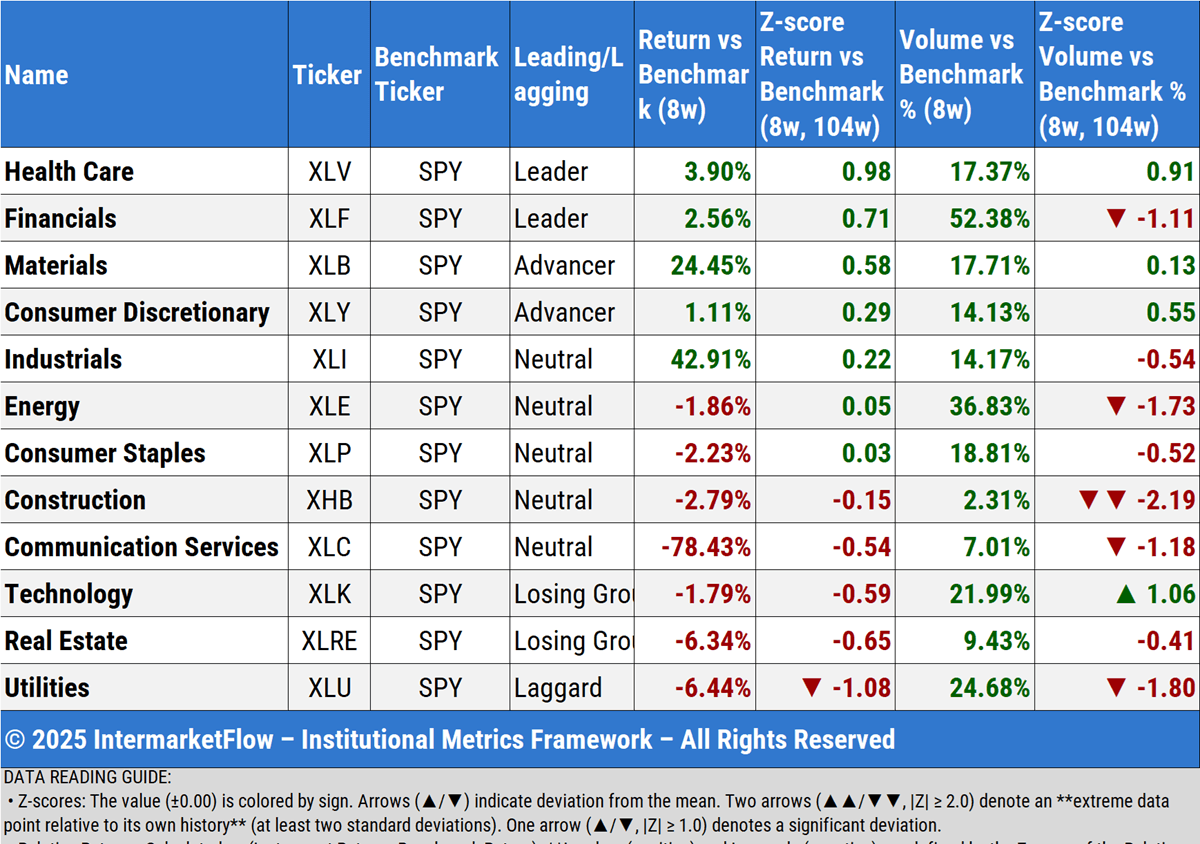
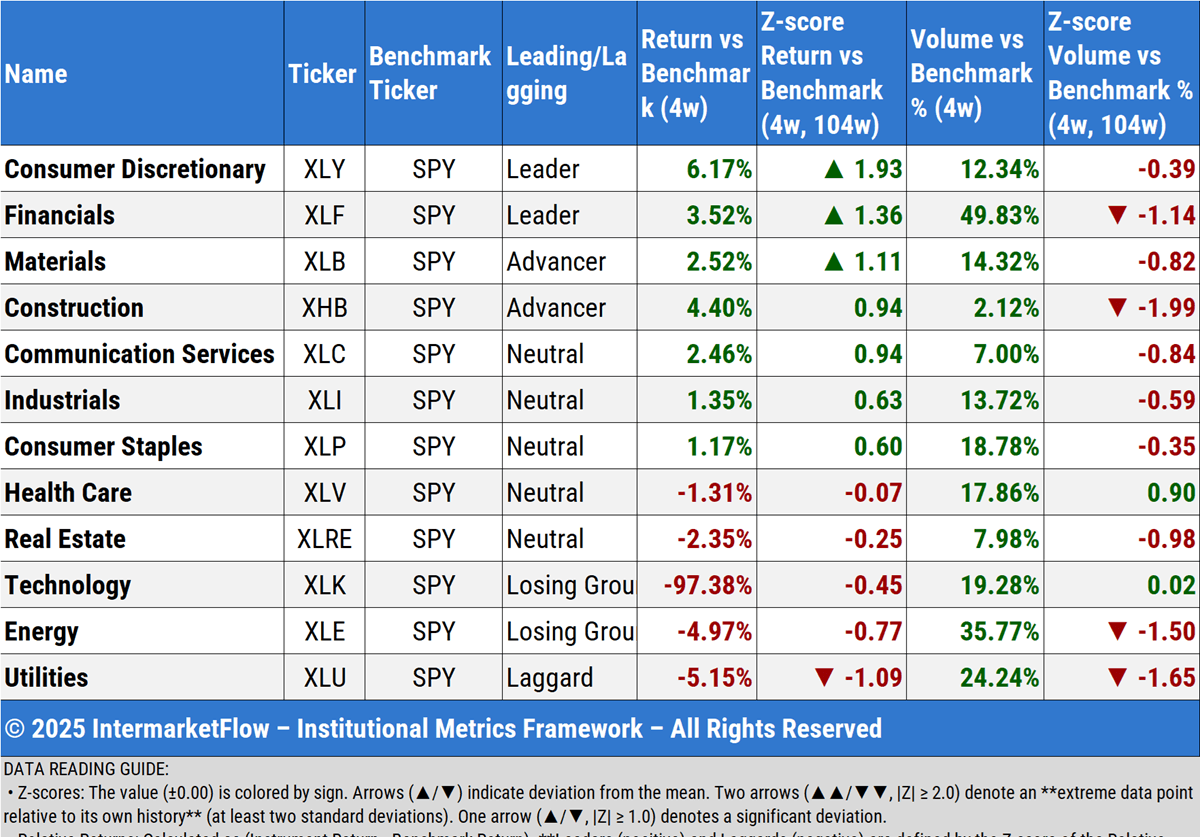
I want you to focus on the evolution of the Financials sector and Utilities. The benchmark for every sector is the S&P 500. How each one behaves versus that benchmark will show us the leaders and the laggards.
12-week moving average

8-week moving average
4-week moving average
Unemployment and sectors
Relative to SPY, over the last three months, Financials have been climbing the ladder and have turned into a leading sector — as they’ve been over the past two months. On the other hand, Utilities have been the economy’s laggard sector for three straight months.
That doesn’t fit our macro (we covered the state of consumer credit here and the rest of the credit complex here) nor our micro thesis (most exposed banks here). More importantly, it doesn’t align with the trend unemployment has been signaling, along with other critical variables.
So where are the opportunities?
We’re looking at two very clear extremes. One is shorting Financials — something that attracts me given all that we discussed about this topic, specially the unrealized losses that will eventually make their way onto the balance sheet.
The other is just how cheap Utilities are relative to the rest of the sectors. If the economy is indeed decelerating the way we think it is, this sector is clearly an opportunity.
The core of a set up
As you already know, I trade on the weekly timeframe. These are trades that can last anywhere from one to four months. I use a variety of tools to build the skeleton , but since we’re looking to trade a mean reversion setup, these are the most risk-sensitive ones for this type of trade.


This trade is based on what we call mean reversion. It’s not about chasing a top; it’s about trying to exploit an overextension.
No doubt, our macro hypothesis and the broader technical picture in SPY could justify looking for a top. In this case, however, the core drivers are the JPM directional Z-scores.
Of course, the rest of the analysis is still critical—but the triggers were not based on it.
By the way, we post on X, intermarket, macro, and technical updates as they come in. I recommend following the account so you don’t miss anything.
Once again, these are not recommendations. This is our work, and we make it public for marketing reasons.
Martin
If you believe this is an error, please contact the administrator.