To frame the broader market environment, we begin with cross-asset flow dynamics by category.

Activity across the main asset classes continues to decline. There is no meaningful movement in the market, including within the “cash is king” segment. Markets remain thin, but panic has at least subsided.
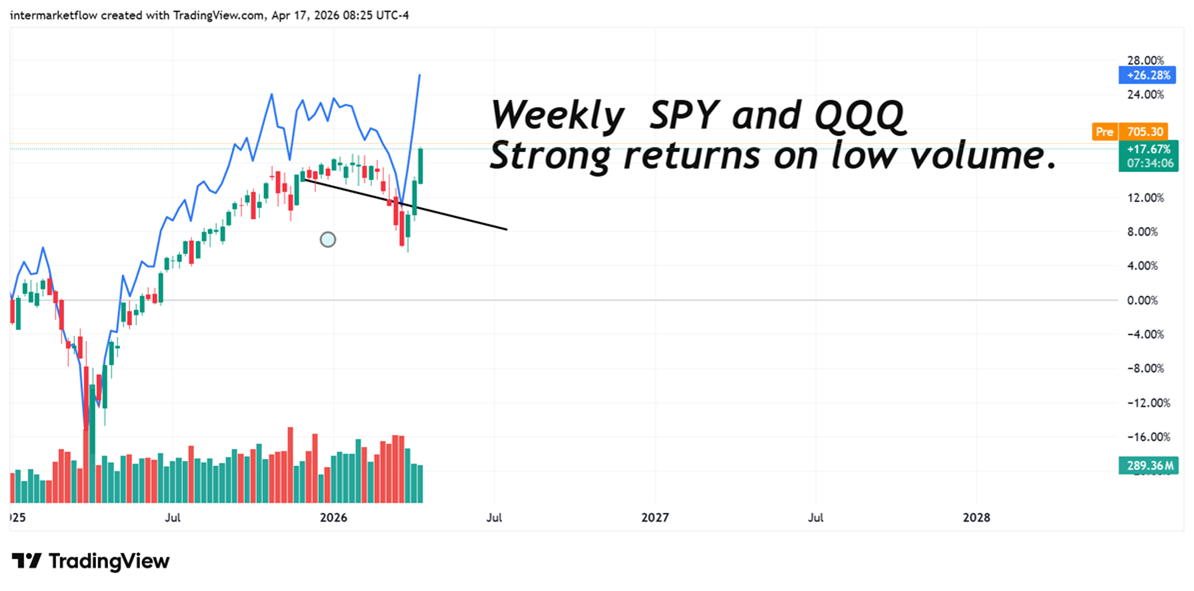
U.S. Equities — the full story
Major indices have broken higher, printing new highs.
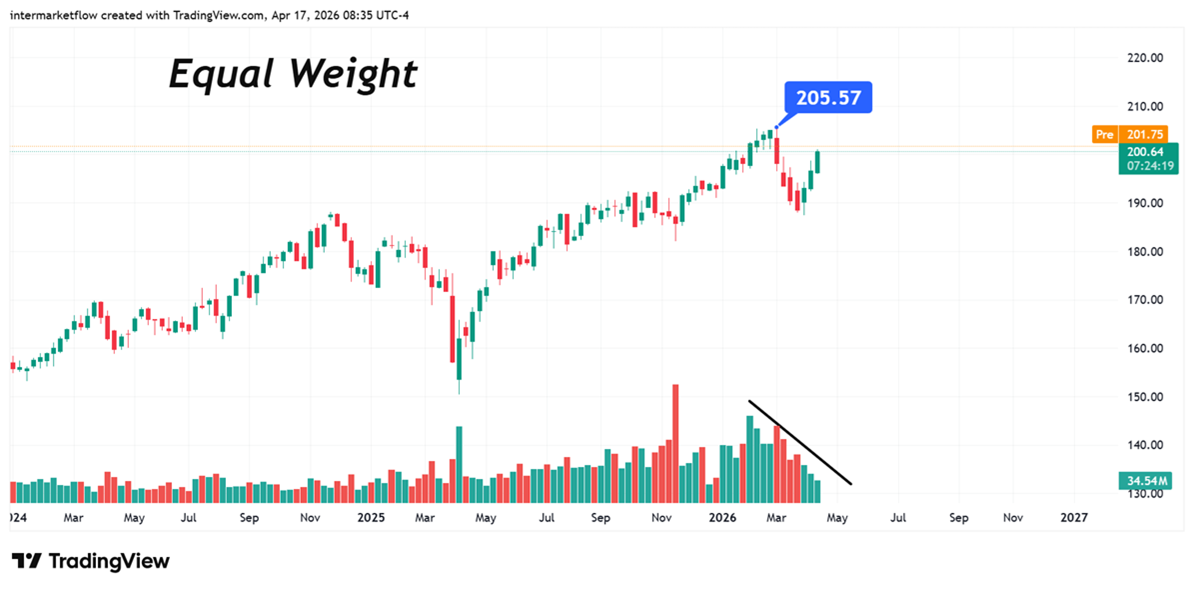
Major indices vs. internal breadth
When equal-weighting the S&P 500, the degree of concentration becomes immediately evident.
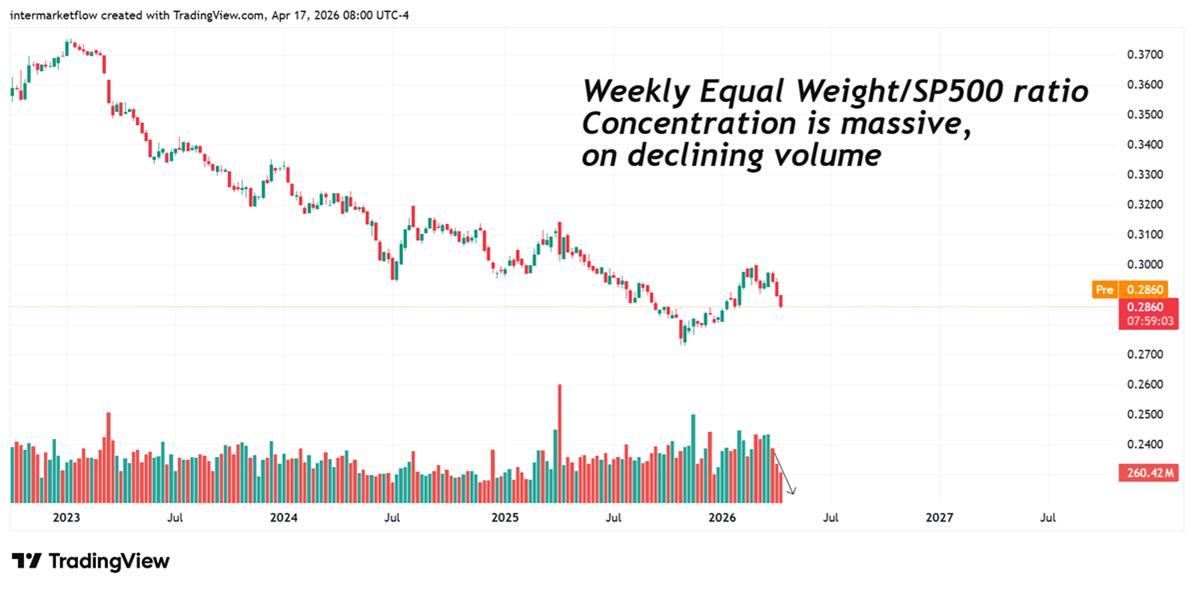
The ratio captures a relative reality, which we further explore by disaggregating into sectors.
The index is fragmented and misaligned. Concentration is extreme, yet the rest of the market is still advancing. These names remain lagging and well below prior highs.
Small Companies
We turn to a different company profile to assess whether this dynamic is being confirmed.

The relative setup versus the S&P 500 is different. The ratio is retesting its most recent high within a broader downtrend. These names are showing greater relative strength than large-cap companies outside the concentration.

Analyzing the sector in isolation, it is trading near all-time highs.
Are we entering a risk-on regime?
Looking at high-beta companies…

There is clear risk-taking. High-beta names are advancing alongside the indices. Market participants are adding risk in an already ultra-thin environment.
Initial assessment
Current activity points to two binary, in the extremes, scenarios:
Scenario 1 — Bull market initiation
- The rally must broaden across assets
- Equal weight stabilizes relative to SPY
- Small caps outperform with a clear pickup in volume
- Final confirmation comes from credit, where high yield is bid, validating risk appetite and invalidating the bearish view
These are the necessary conditions for a sustainable bull market. Confirmation is gradual and unfolds over weeks, as alignment builds across assets. A strengthening economic backdrop would reinforce this scenario.
We do not validate this scenario in any way.
Scenario 2 — Rally failure and our position
- Large-cap indices stall
- Risk takers unwind quickly
- Neither small caps nor equal weight catch up to the main indices
- Credit fails to confirm and volume remains depressed
This scenario tends to validate much faster. It reflects a short squeeze driven by a narrow group of names, typically followed by a cascading decline.
Synthesis
Current price action reflects a structurally fragile setup. The index remains highly concentrated, with most constituents unable to match the pace of headline indices, while high-beta segments advance aggressively. This combination—market fragmentation, extreme concentration, and low liquidity—defines a high-risk environment and, as we will see, creates opportunities.
Taking risk through high-beta companies while the index remains this fragmented is contradictory.
Intermarket Flows
We deepen the analysis from multiple angles.

Equities are advancing strongly—led by growth and risk assets—while the yield curve shows declining activity, weak returns, and collapsing volume across both the short and long ends. This divergence is clear: risk is being bid without macro confirmation. The curve is not pricing stronger growth or tighter conditions; it remains inert.
The implication is direct: this rally is driven by positioning and liquidity, not economic expansion. Without reactivation in rates or confirmation from credit, the move lacks structural support and leaves equities exposed to a sharp repricing once current flows fade.
Sector view — Key takeaways

- Technology leads decisively → primary driver of index performance
- Cyclicals weak (industrials, materials, financials) → no macro confirmation
- Defensives also weak → no flight to quality
- Broad underperformance vs SPY → participation is shallow
This is not a healthy rotation. The decline in cyclicals points to economic deceleration, while defensives remain weak. Both underperform the index with lower activity, and volatility is elevated in these segments—signaling disorder rather than a structured shift.
The opportunity lies in volatility.

The volatility term structure has normalized. Spot volatility is now in extreme complacency at very low levels. Hedging today against the volatility the market is pricing 6–8 weeks forward is extremely cheap.
Conclusions
- Extreme concentration: growth and mega caps are carrying the entire move
- Weak breadth: the rest of the market is not confirming
- No flow: activity and volume are broadly declining
- Cyclicals deteriorating: real economy does not validate the move
- Defensives weak: no flight to quality
- Disorderly structure: elevated volatility in laggards, not a clean rotation
- Neutral credit: no confirmation of risk or expansion
- Unstable regime: dependent on leadership holding
- Risk-on contradiction: high beta advancing within a fragmented market structure
- Volatility mispricing: forward risk is being priced, but current complacency keeps hedging costs low
Final read
Price is advancing, but the structure is weak, internally inconsistent, and vulnerable to a fast repricing once flows fade or leadership fails. Market makers are forced to buy more and more equities to hedge the options they sold, reinforcing the upside. This dynamic typically ends in a violent “gap down” once buying flow weakens.
Our stance
Our framework remains unchanged. The directional bias stands, and the invalidation zone remains intact.

Actionable framework
- Do not chase price: adding exposure in tech or small caps at these levels assumes flows will continue to override structure
- Exploit complacency: the asymmetry is in protection—SPY/QQQ puts or long volatility—where forward risk is priced, but current levels remain underpriced
Intermarket Flow
P.D. — Free Trial Last Call
This is an execution framework, not research.
We’re tracking a dislocation between price and real flow (Z_DV). When it breaks, repricing will be fast and violent.
If your trial ends now, you lose IF Blocks and real-time flow tracking at the worst moment.
If you believe this is an error, please contact the administrator.
Don’t go blind. Upgrade to Pro.