Sunday Strategy: The Liquidity Mirage & The Credit Fracture
The past week was defined by one thing: the absence of depth. Within a compressed 2.5-day trading window, price action unfolded in a thin market environment—a vacuum where false breakouts and one-sided moves are not signals of strength, but symptoms of mispricing.This is not low conviction. This is distorted price discovery.

There is no capital outflowing category, and no clear recipient. The adjustments driven by shifting inflation expectations appear largely complete. Like a flock of swallows, capital is clustered on the same tree—parked in dollar-denominated money markets or ultra-short duration debt.This concentration is not stable. It is latent instability.
A system where all capital sits in the same place does not eliminate risk—it compresses it. And when that equilibrium breaks, volatility does not emerge gradually. It releases. This behavior is what later shows up in charts analysis from a technical perspective—the compression of volatility that precedes the expansion.
Statistical Noise: Z-Score Analysis
The following tables compare market activity at the onset of the conflict, eight weeks ago, versus what we observed this past week.
The Data
All metrics are normalized using Z-scores to strip out the noise.
But removing noise exposes something more important: distortion.
Returns: The Main Event of last week
Pay close attention to this week’s returns (second column) measure in statistical deviations from mean. These are extreme moves—clear standard deviation outliers. We can think of a value +/- 2 like a black swan event.
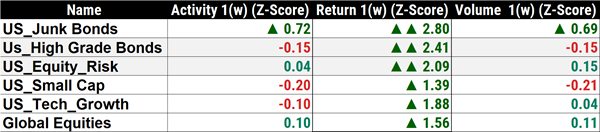
Under normal conditions, these would imply strong directional conviction.This is not a normal environment.
As confirmed by the volume column (the third one), these returns are being generated in a market with no depth. In this regime, marginal flows create disproportionate price displacement. Price moves not because of aggressive positioning, but because of a lack of opposition. This is not strength. This is air.
The Break of War: What Panic Looks Like
Two months ago, the conflict broke out. Crude prices surged, and with them, inflation expectations. Fourteen months without rate adjustments were repriced in just two days—we highlighted this in the report dated March 15th
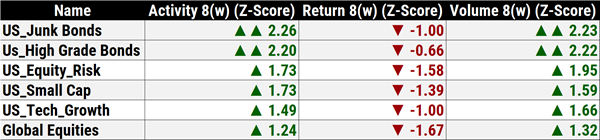
From week 8 through the week that ended this Friday, that move extended until it reached a vacuum—where there is simply nothing left to reprice.
The system did not stabilize. It exhausted itself.
The Move in the S&P 500
When you look at the weekly returns of SPY, they are indeed impressive. A 2.09 sigma deviation is, without question, statistically extraordinary. You can infer it by looking U.S Equity in the table.
But statistics without context are misleading.

When contextualized within the volume that produced it and the broader activity of the week, the move loses representativeness. It is real—but it is not informative.
Equities are not leading here. They are reacting within a distorted liquidity regime.
The Credit Trade: Where the Signal Actually Is
In the mid-week report, we framed our trade as a credit crisis opportunity.
We are not trading equities.
We are using them as a vehicle to express a credit view.
This distinction is not semantic—it is structural.
Equities are the surface. Credit is the signal.
Validating the Mid-Week Report: JEF and FITB
In our last report, we highlighted the divergence between names and their specific stages within the correction process. The current data confirms those setups.
JEF (Jefferies)

JEF remains the laggard. Even within a broader relief rally, it was unable to attempt a meaningful bounce. This level of extreme relative weakness is not noise—it is information. It reinforces the downside thesis and signals that credit-sensitive segments are not participating in the rebound.
FITB (Fifth Third Bancorp)
Conversely, FITB managed a rebound that reached roughly the 38% retracement level. It has now entered the sell zone we identified—a tactical area where institutional flow typically reloads short exposure, using retail liquidity as the exit.

Different behavior. Same conclusion.The system is not recovering. It is redistributing risk.
The Macro Litmus Test: HYG
Ultimately, the framework resolves here. HYG is not another chart. It is the judge of our timing and hypothesis.

The Bounce
HYG moved higher this week alongside equities. But the move remains well below our invalidation zone.
The Reality
A minor bounce in a structurally broken credit market is a non-event.
Unless we see a sustained bid that clears key resistance levels, the Credit Fracture remains intact.A market that rallies on nothing can collapse on anything.
And until credit repairs, rallies in equities are not recoveries—they are opportunities.
Intermarket Confirmation: The System Is Not Aligned
When we widen the lens, the message becomes consistent:
- Gold is accelerating again
- Crude remains unstable
- The dollar is acting as the primary safe haven
- Both bonds and equities are serving as sources of capital
This is not rotation. This is withdrawal. We remain in a cash-is-king regime with some difference from previous weeks. Capital is no longer running—but it has not found direction. It is paused, scanning, operating under extreme vulnerability and risk aversion.
The Setup
Our hypothesis is that this environment transitions into a deeper correction—particularly across assets with high sensitivity to credit conditions.
Not because of a single catalyst.
But because the system is already misaligned.
Liquidity is distorted. Positioning is concentrated. Credit is fragile.
That combination does not resolve upward.
Final Read
This is not a confirmation phase. It is a transition phase.
The last chart—HYG—will determine whether we are right on both thesis and timing, or wrong on one, or both.
But the framework is clear, this is not a market driven by strength.
It is a market held up by the absence of resistance.
And that is not a foundation.
If you believe this is an error, please contact the administrator.