
Post Fed Market Report: Volume Arrived, Confirmation Did Not
What We Established in the Previous Report
- The market was operating under a Hands-Out regime with no clear Risk-On or Risk-Off bias.
- Our hypothesis was—and remains—that the regime itself carries an implicit message.
- Capital is not rotating decisively between risk and defense. It is moving out of risk and remaining on the sidelines.
- In a market defined by apathy, limited depth and weak participation, price alone is insufficient.
- Any directional move requires confirming volume.
- We also identified a growing disconnect between rates and equity volatility.
- Equity implied volatility remained excessively compressed relative to the rates shock and needed to adjust. Within an otherwise unconfirmed market structure, mean reversion in equity volatility was the only viable trade at that stage.
Risk Appetite Regime today
- No change.
- We monitor volume daily.
- The post-Fed move introduced meaningful participation, but it did not alter the prevailing Hands-Out regime.
- That regime remained intact through yesterday and remains our base case.
What Happened Post Fed?
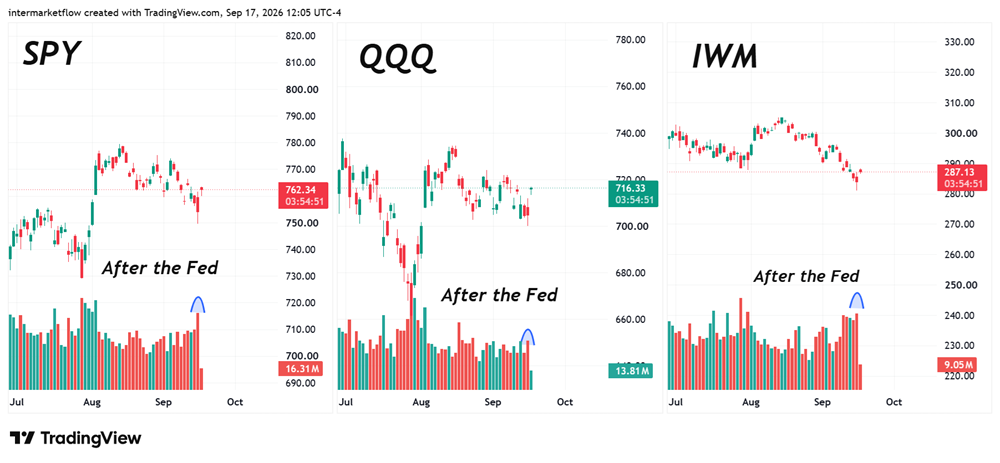
- The initial reaction produced a bearish impulse and a lower low.
- It was followed by a bullish rebound within the same bearish structure.
- The rebound has not established a higher high.
- We are now looking for a failed upside move to confirm that the bearish structure remains active.
This distinction matters: price reacted, but direction has not yet been technically confirmed.
Post Fed: Returns, Volume and Dollar Value
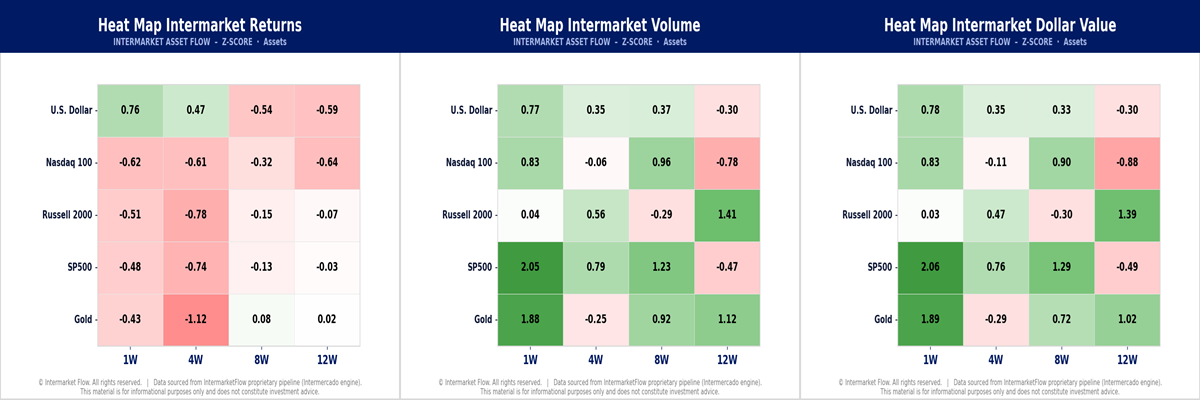
- Before the Fed decision, apathy and limited market depth remained in place.
- This left prices highly sensitive to relatively small changes in capital flows.
Post Fed move changed one important variable: volume arrived
Our weekly confirmation threshold was a volume z-score above +1.5σ.
- Both Gold and the S&P 500 exceeded it, confirming that real participation entered the market.
- Volume concentrated at opposite ends of the structure: Gold and the S&P 500, shown in the final two rows of the middle chart.
- This split does not establish a unified risk preference.
- It shows that capital became active without resolving the market’s directional conflict.
- Dollar Value z-scores confirm the same development. Significant capital moved through both assets, with substantial inflows and outflows.
The conclusion is precise: volume confirmed participation, but price has not confirmed direction yet.
Equity and Bond Volatility
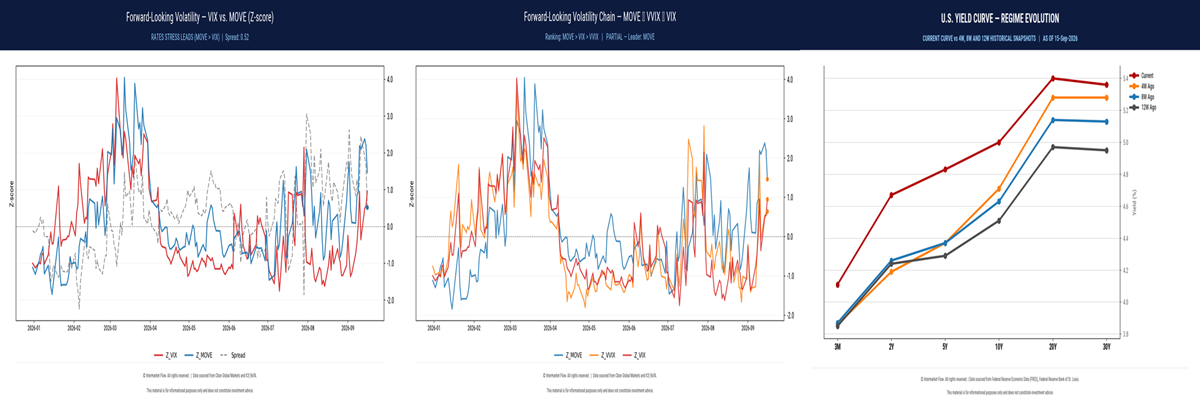
- Equity 30-day implied volatility repriced higher, beginning to adjust to the stress already visible in bonds.
- That move validates the mean-reversion thesis from the previous report.
- The volatility adjustment occurred, but the broader rates shock has not necessarily finished transmitting into equities.
- The third chart shows the remaining valuation asymmetry. The yield curve is bear-flattening, driven by higher short-term rates, while equity valuations have not fully priced in that shift.
- The shock is still unfolding. It may extend or lose momentum from here.
The problem is timing: a gradual grind higher in rates can persist without producing an immediate equity repricing.
Current Hypothesis
- The Hands-Out regime remains intact.
- Post-Fed volume confirmed participation, not direction.
- Price has produced a lower low, but technical confirmation is still missing.
- Equity volatility has started adjusting to the rates shock.
- A valuation asymmetry remains because equities have not fully priced in the yield-curve move.
Small-Cap Asymmetry
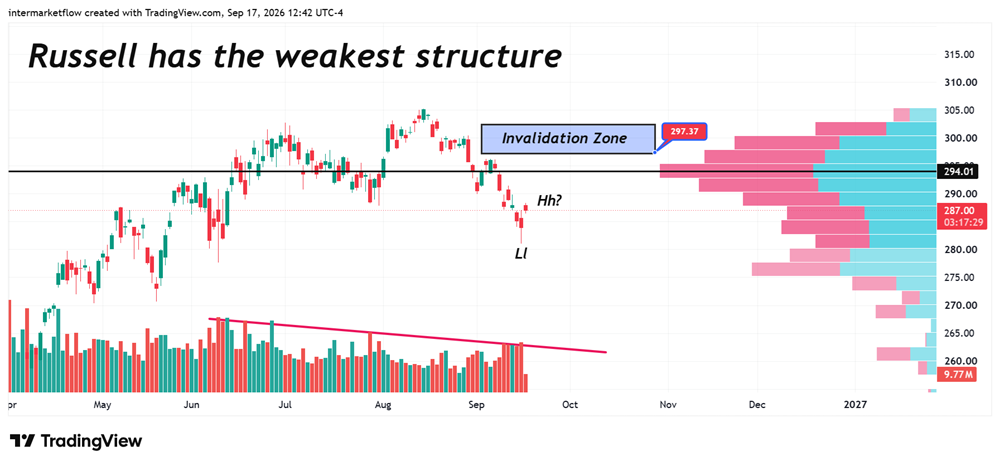
- We express the bearish scenario through the Russell because it has the weakest market structure and the greatest sensitivity to tighter financial conditions.
- If the rates shock continues to transmit into equities, it offers the cleanest expression of the asymmetry.
- The same exposure can be expressed through small caps, high-beta assets, credit-dependent sectors or broader rate-sensitive risk.
Triggers
- Technical confirmation would come from a failed upside move: an inability to extend higher.
- Sideways price action without establishing a higher high.
- Value zone and potential entry range: $287–$294.
Invalidation Zone
- The invalidation level is $297 on the IWM vehicle shown in the chart.
- This level provides a comfortable margin above both the latest equilibrium price—the Point of Control—and current resistance.
- A sustained break above that zone would invalidate the failed-rebound thesis and require reassessing the bearish scenario.
Continue Following the Market
Your trial has ended, but this market structure is still evolving.
Keep access to our Sunday and Wednesday reports, including regime analysis, capital flows, statistical extremes and clearly defined invalidation levels.
Subscribe to IntermarketFlow and continue tracking the full intermarket picture.
Intermarket Flow
OR
UPGRADE
Free trial has expired.
If you believe this is an error, please contact the administrator.
If you believe this is an error, please contact the administrator.
OR
UPGRADE