On the weekly timeframe, the market initially reflects a classic flight to quality (FTQ) environment: Gold, Treasuries, and the Dollar rise simultaneously, as capital moves toward safety within the financial system.

However, at a certain point — the start of the war — the market abruptly shifts into panic.

That panic quickly morphs into a “Cash is King” — or simply “Dollar is King” — regime. The Dollar begins absorbing global flows as capital dollarizes and seeks refuge in short-duration instruments, mainly money markets and Treasury bills.
Cash is King: The Opportunities Panic Creates

Looking at the correlation between the S&P 500 and bond prices across the entire yield curve over the last two years, the relationship was almost negligible. For roughly 23 months the two markets had effectively decoupled.
The panic effect triggered these correlation breakdowns
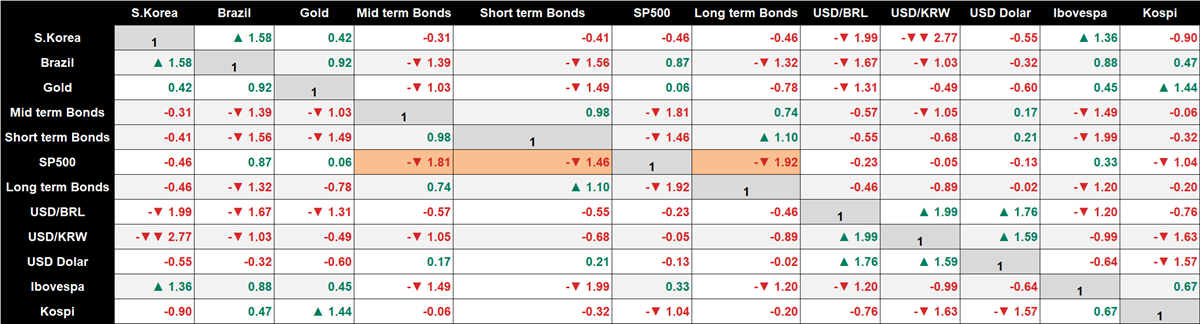
Over the last four weeks, the correlation between the S&P 500 and Treasuries (Bills, Notes, and Bonds) has shifted violently. Equities have once again become highly sensitive to interest rates. The relationship has flipped.
The S&P 500 is now showing a strong positive correlation with yields (and therefore negative with bond prices).
This is not a small change. It is a regime shift.
We are moving through three distinct phases:
- Flight to Quality
- Cash is King
- Hard Landing
They may look similar on the surface — they are not even remotely the same.
Extra risk 1: The Hidden Driver, Solvency Risk
Just before the war began, a credit solvency crisis was already starting to surface.The war did not create the problem.It simply buried it under a much louder narrative.
Extra risk 2: The Yen Carry Trade
Another systemic vulnerability remains: the Yen carries trade. Today, the profitability of the trade depends on three variables: Interest rate differentials, Yen depreciation, and the relative performance between the S&P 500 and the Nikkei.
The weaker the Yen becomes, the more profitable the trade remains. At this stage, the players still positioned are largely those who did not hedge the FX risk. (Details on the yen carry here)
But that dependency creates a structural risk. If the Yen strengthens or equities weaken, the trade can begin to unwind, amplifying downside pressure across global risk assets.
Post, Cash is King moment: Tuesday’s action, a bull trap
On Monday the S&P 500 entered the selloff driven by the “Cash is King” phase, in the same way Brazil and Korea did earlier. In practical terms, the S&P 500 was traded like an emerging-market risk asset.
Once that happens, the distinction between Flight to Quality stage and Cash is King scenario becomes largely irrelevant for SP500. If the market treats the S&P 500 as a risk asset, it will correct.
The only question is magnitude and violence.
Intermarket: Three Scenarios Ahead
- Intermarket flight to quality
Bonds rise, AAA corporate debt rises, and gold rises.
The S&P 500 corrects but remains relatively resilient.
This is a risk-off rotation, not a systemic event.
- Cash is King
Everything gets sold. Treasuries, corporate bonds, gold — and equities even more aggressively.
The S&P 500 temporarily loses its “developed market” status and is treated like an emerging-market risk asset.
Key signals:
Credit spreads widen (HYG vs LQD), VIX rises, Liquidity disappears
- Intermarket Hard landing after cash is king has faded
This is the final stage.
Yields collapse alongside the S&P 500 as the market fully prices economic contraction.
Two forces could accelerate the process:
- The credit solvency crisis
- The Yen carry trade unwind
When both start interacting, the downside can accelerate violently.
Conclusions
- Zero Beta increasingly transformed into an attack position on risky assets especially, but not only Financials.
- Adding duration
- US dollar exposure should be diversified to anticipate what will likely end with a Fed intervention.
- Rotation into risk off assets
All of this depends on horizons and risk preference.
S&P 500 (SPY) — Short Execution Card
Entry A — Dead Cat Bounce Thesis
Institutions need liquidity to exit positions at higher prices.
The strategy is to sell into temporary strength when price hesitates near the invalidation zone. The Fibonacci retracement level 0.618 in 684.
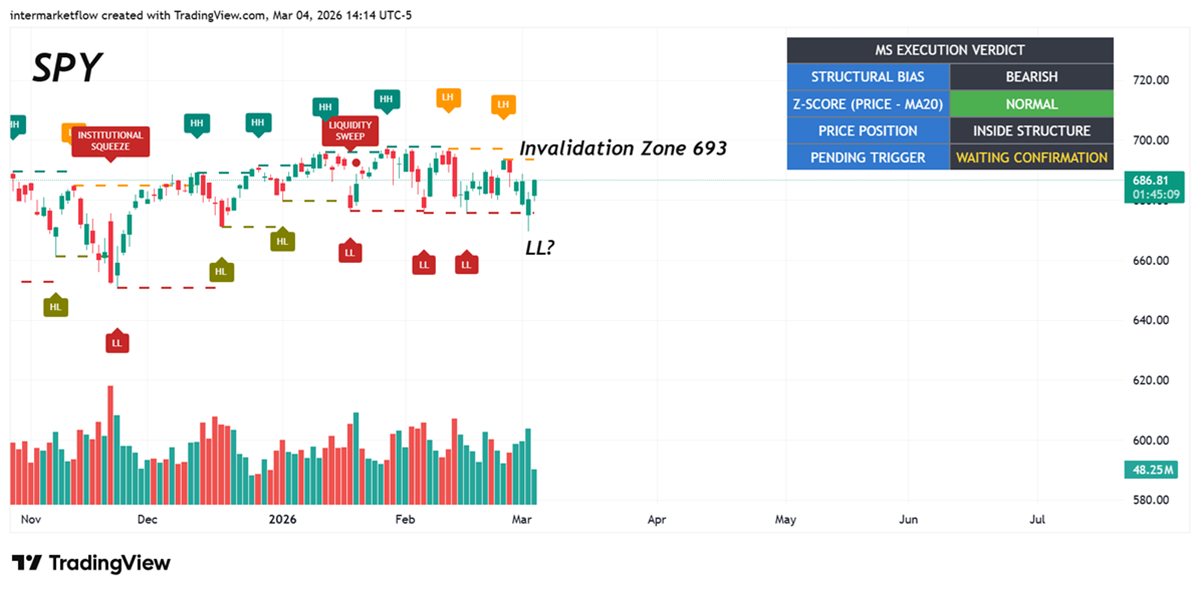
Entry B — Confirmation Trade
A closing daily price outside of market range. (675). Reloading time if entry A was used.
Risk Management
Do not remain positioned if daily closes move above the invalidation level. (693)
Trade Box


This trade is not purely technical. It works as long as the Hard Landing remains the final outcome of this sequence
Targets: 650
Depending on how other variables evolve — such as HYG, LQD, and credit spreads, target could change either way.
If you believe this is an error, please contact the administrator.