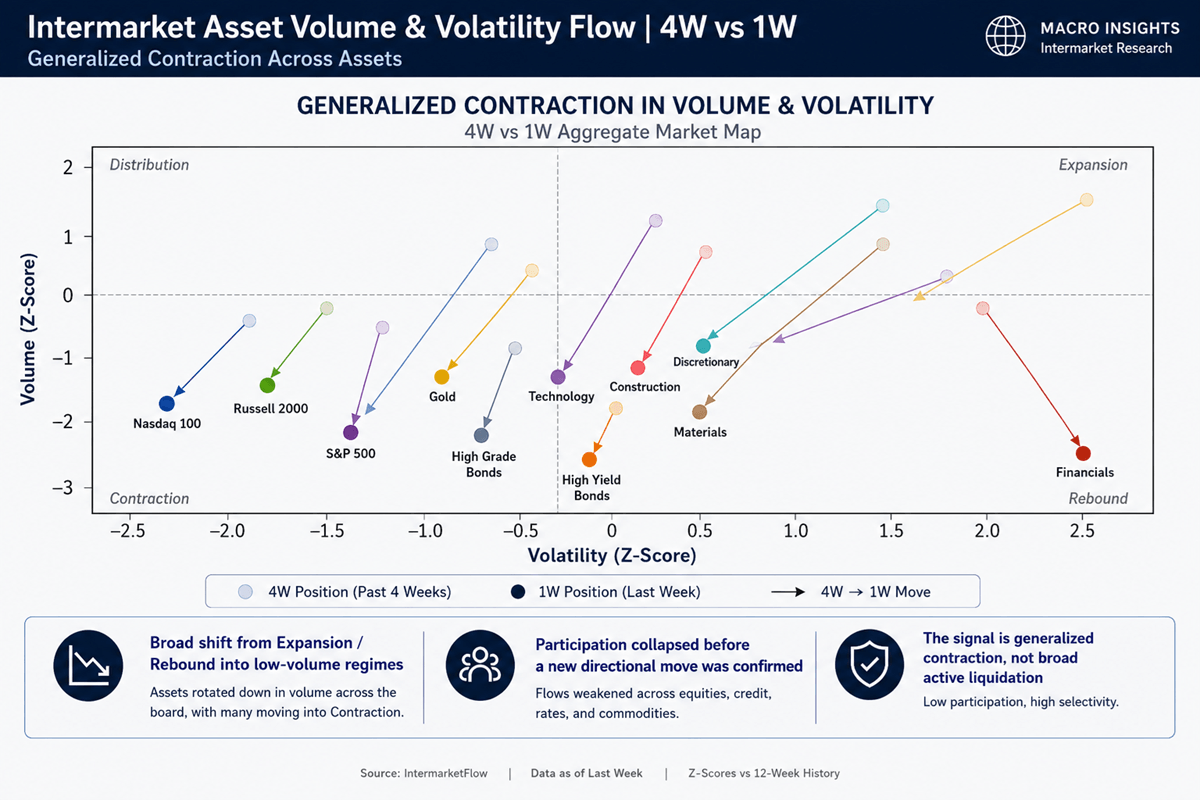
The current regime persists in its direction: an orderly contraction of volume and volatility—devoid of panic, yet lacking direction. The exit from Risk On assets is not translating into rotation toward Risk Off. Capital is not seeking cover; it is concentrating in dollars within money markets, where even short-term debt lacks traction. This dollarization functions as a liquidity drain, the essential oxygen of the markets.
In the volume and volatility Z-Scores (4W vs 1W), we observe assets operating at -2 and -3 sigma levels. This extreme deviation necessitates a mean-reversion adjustment, the execution of which depends strictly on the time horizon.
Asset Analysis: Technical Diagnosis
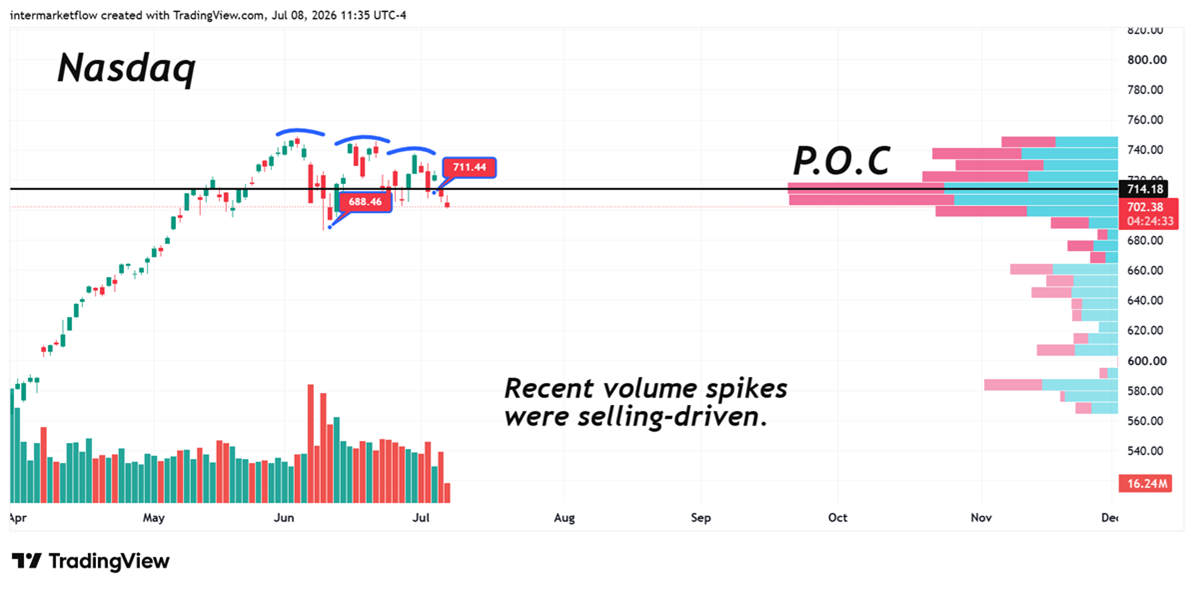
Nasdaq 100 (Systemic Weakness): A relentless vector toward contraction. The transition from high activity to low activity with negative return confirms a pure technical exit. Supply is being absorbed by a liquidity vacuum; there is no “buy the dip”
Currently sitting at its 12-week equilibrium price, creating a false sense of value. Divergence Critical: The price implies stability, but the Z_DV (flow) confirms a pure technical exit. This is a liquidity vacuum, not a support zone.
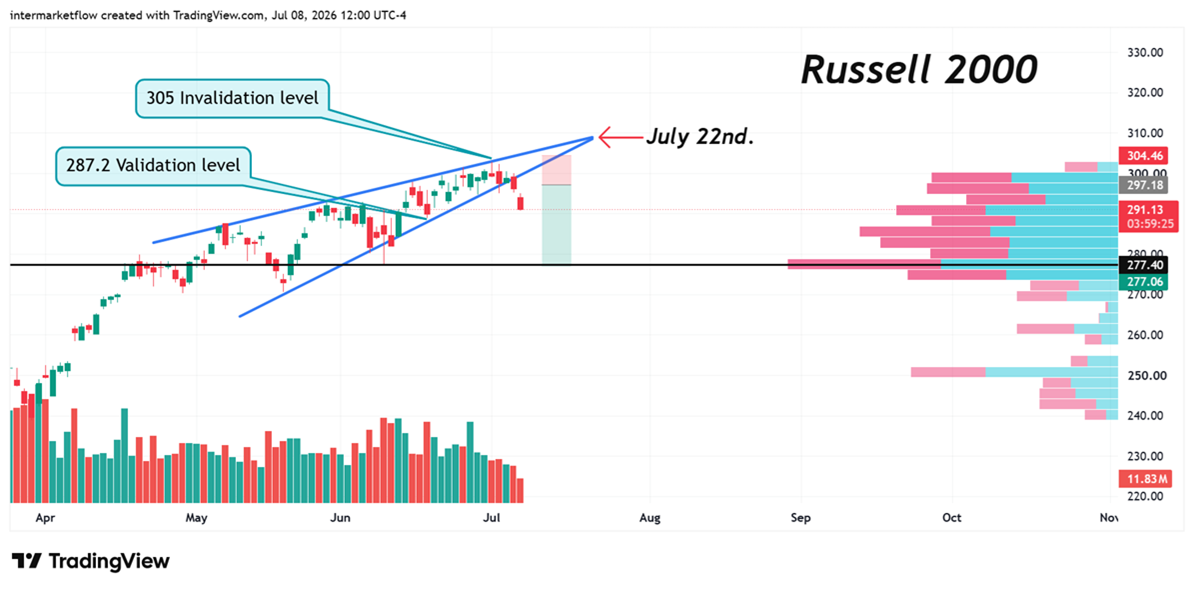
From previous reports, we bring back this chart updated to today’s prices.
Russell 2000
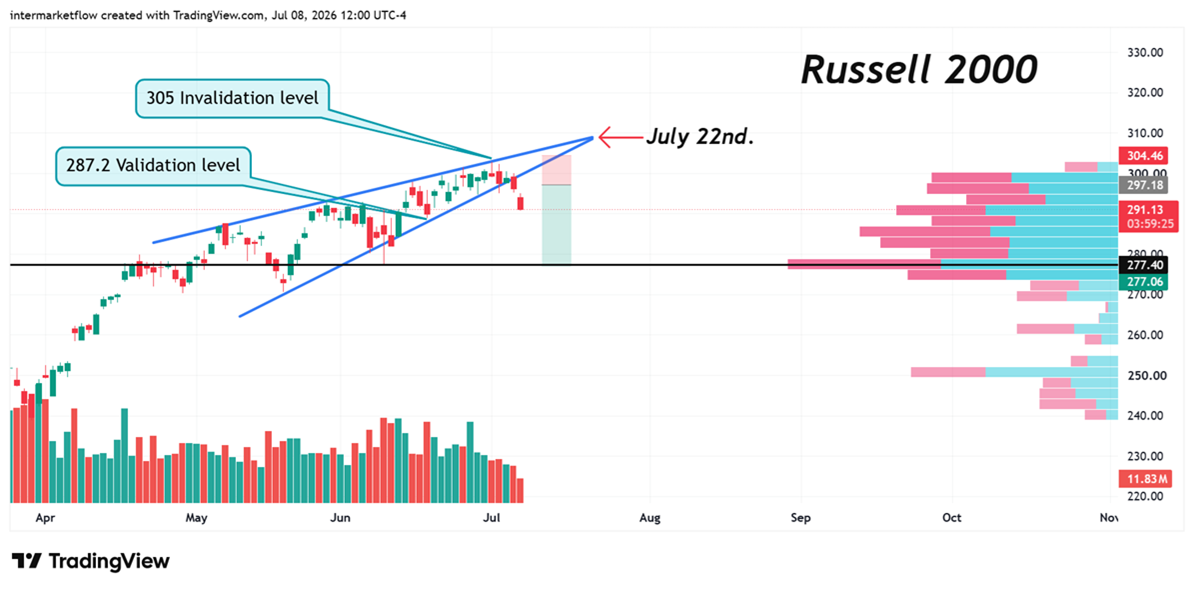
A vertical drop trajectory with a more aggressive activity Z-Score than the Nasdaq. Any support level is a statistical illusion; the evacuation of small-cap beta is total and accelerated.From previous reports, we bring back this chart updated to today’s prices.
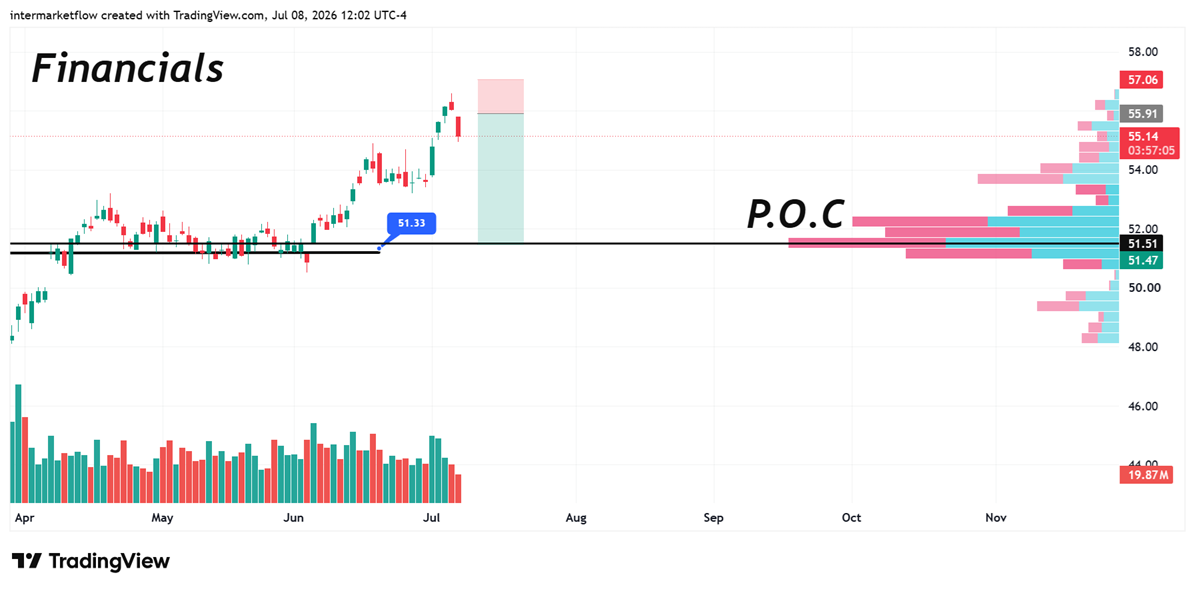
Financials (Rebound Anomaly):
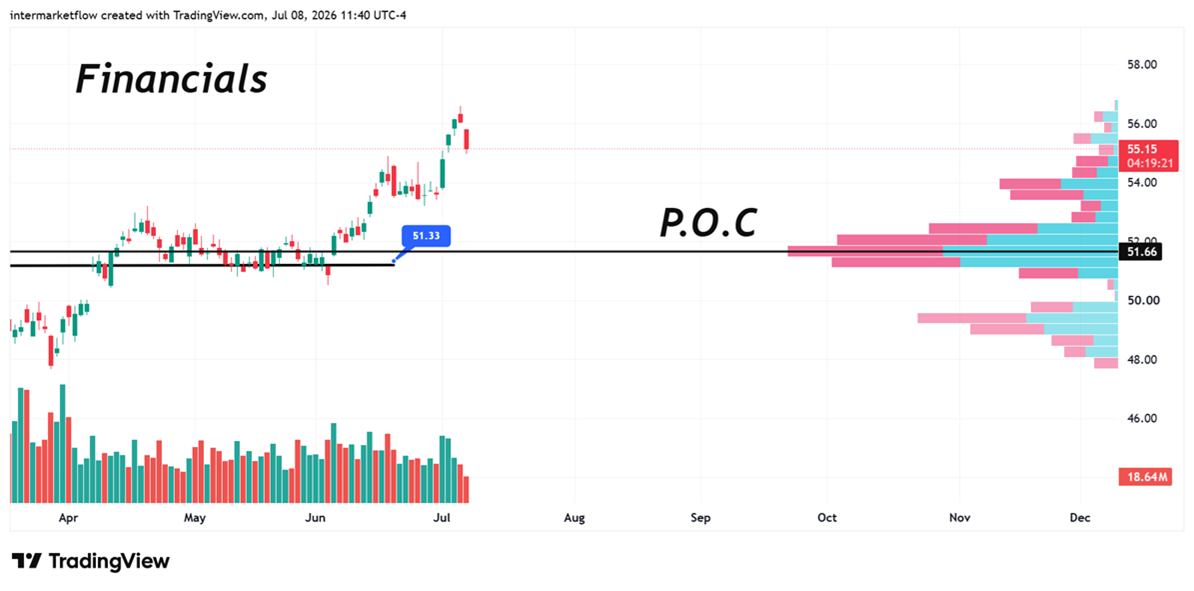
A divergence in return that conceals a technical trap. The crossover with Vol/Volat confirms this rebound is occurring under increasing volatility and non-existent volume: a conviction-less bull trap.
Trade Setups: Equilibration Execution
The Nasdaq 100 sits at its 12-week equilibrium price with convergent weakness. Russell and Financials present the widest statistical deviations.I. Russell 2000 (IWM): Short Reversion towards equilibrium prices (Mean reversion towards P.O.C)
Setup: Asset exhausted of supply with no structural buyers (Z-Score of activity at -3).
Reading: Convergent weakness in return and volume (1W vs 12W) dictates that any upside will be a purely technical bounce.
Execution
Entry: Shorts on technical bounces toward the 4W mean (gap zone)
Invalidation: Reversal of Z_DV to positive territory (real flow).
Target: 12W equilibrium price. P.O.C 277
Stop loss 306
Risk-Reward 2.76
II. Financials (XLF): Bull Trap Fade
Setup: Return divergence without volume backing. Fragile price structure with low Z_VOL and high Z_VOLAT.
Reading: The rise is a symptom of illiquidity in the order book (scant selling, non-existent buying), not capital inflow.
Execution
Entry: Shorts upon confirmation of volume failure during rallies.
Invalidation: If Z_VOL exceeds the 4W historical average during the rally.
Target: Mean reversion towards 12w period equilibrium price 51.51
Stop loss 57
Do not trade mean reversion as a value strategy. In a negative Z_DV regime, you are trading liquidity equilibrium, not a trend change. If volume does not validate the move, the asset will continue its decline until volatility erodes remaining positions.
Until today we do not have a regime or trend change, we watch markets from a pure statistical lens.
This is our work, which we make public for marketing purposes. It is not a trading recommendation.