
The Liquidity Trap Behind the Market
- The core signal this week is not price weakness. It is the structural repricing of risk. Short-term yields have become strong enough to compete directly with equities, credit, duration and even defensive assets.
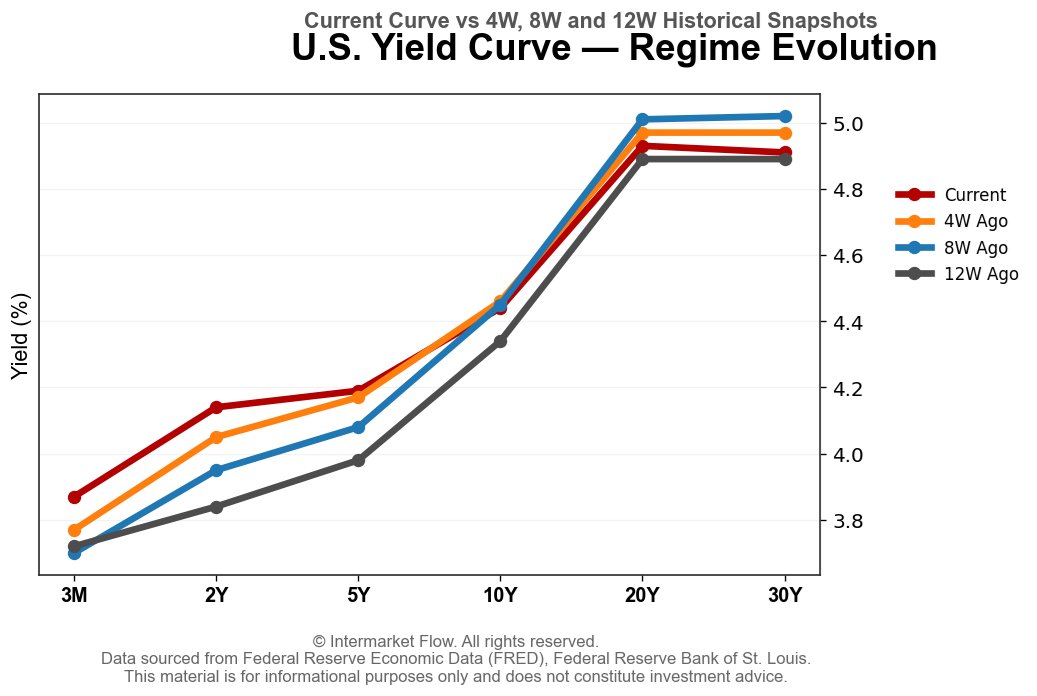
- The front-end of the curve remains the dominant force. As the 2-Year Yield rises relative to the long end, the required premium for holding risk assets increases. That is the foundation of the liquidity trap.
Systemic Liquidity Withdrawal
- The data shows a synchronized collapse in volume across all categories in the 1W window. This is not rotation. It is a broad-based withdrawal of participation, where the market is losing its ability to absorb selling pressure.
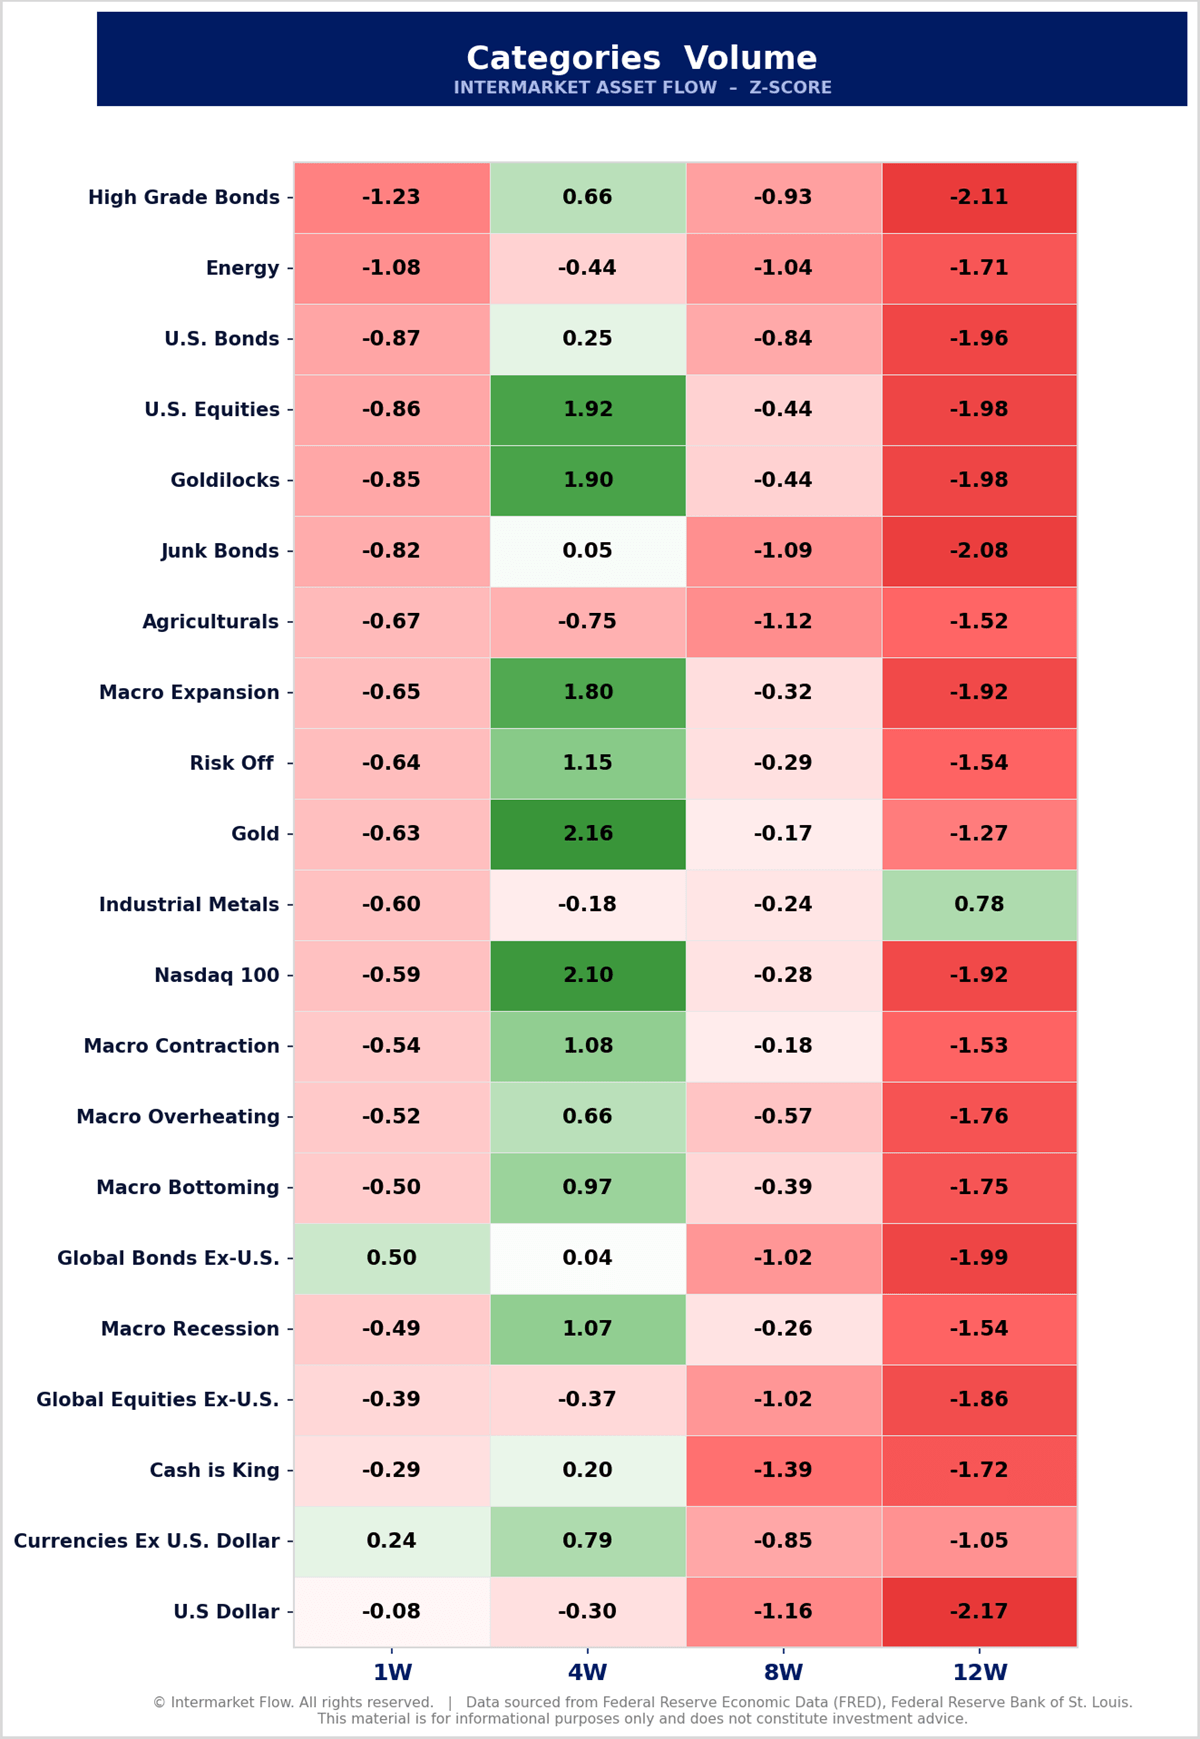
The Liquidity Trap
- Because the exit is indiscriminate, several correlation readings versus the 2-Year Yield have moved to a +1.0 Z-score in the weekly timeframe, as evidenced by the correlation heatmap across multiple time windows below.
- The heatmap shows how sensitivity to the 2-Year Yield has expanded across different timeframes.
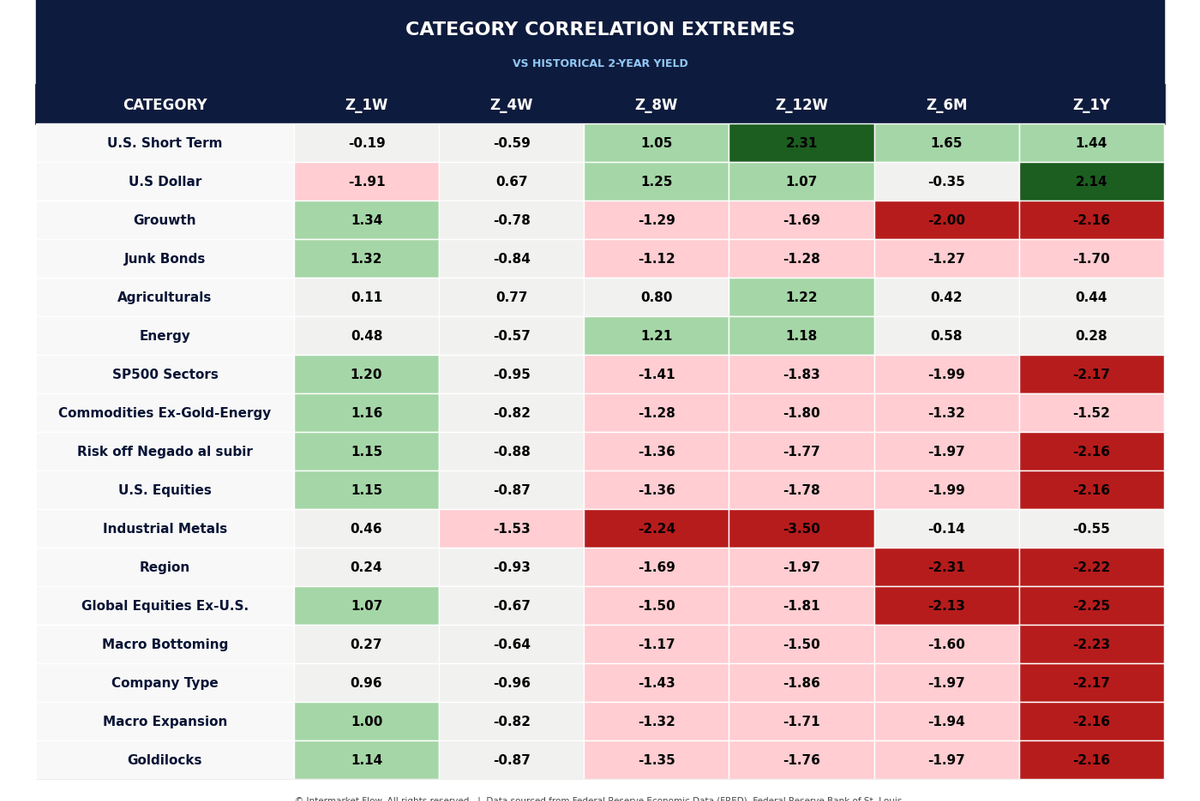
- The signal is not the 1W snapshot. The signal is the evolution across timeframes. What matters is not where the market stands today in isolation, but how it moved from the 12W structure into the 4W window and finally into the last week.
Conclusions
- The bear flattening is the regime change.
- Volume collapse is the liquidity warning.
- Correlation Z-scores +1.0 with 2 year yields is the portfolio trap.
- This is not a market waiting for direction.
- This is a market losing the structure that allows risk to be held.
Thesis Invalidation Protocol: When to Pivot
Our Systemic Liquidation thesis is built on the intersection of two forces: bear flattening and liquidity collapse.
The following events would invalidate our bearish bias and force an immediate shift to neutral — or bullish — depending on the strength of the confirmation.
- Yield Curve Re-Steepening:
A structural widening of the 2Y–30Y spread would signal that the opportunity cost of holding risk is normalizing and that the liquidity trap is starting to dissolve.
- Systemic Volume Resurgence:
A sustained return of positive Z_Volume in the 1W window across major asset classes would prove that institutional participation is returning to the market.
- Asset Correlation Decoupling:
A breakdown in correlations with the 2-Year Yield would signal that defensive assets are once again working as hedges against equity risk. That would restore real diversification.
- Technical Structural Breakouts:
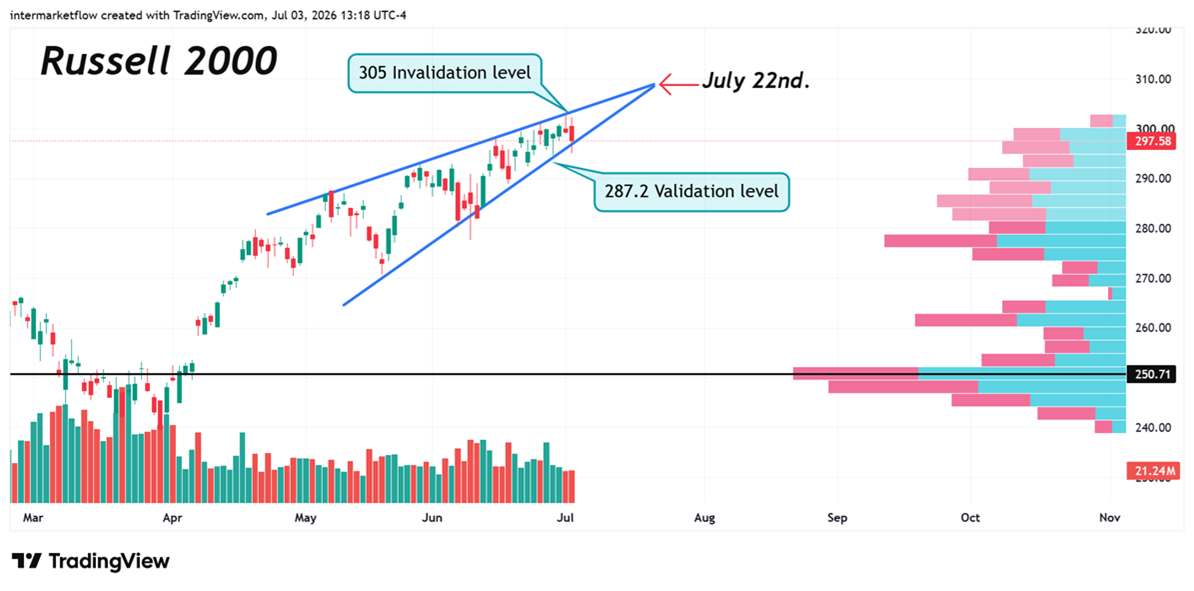
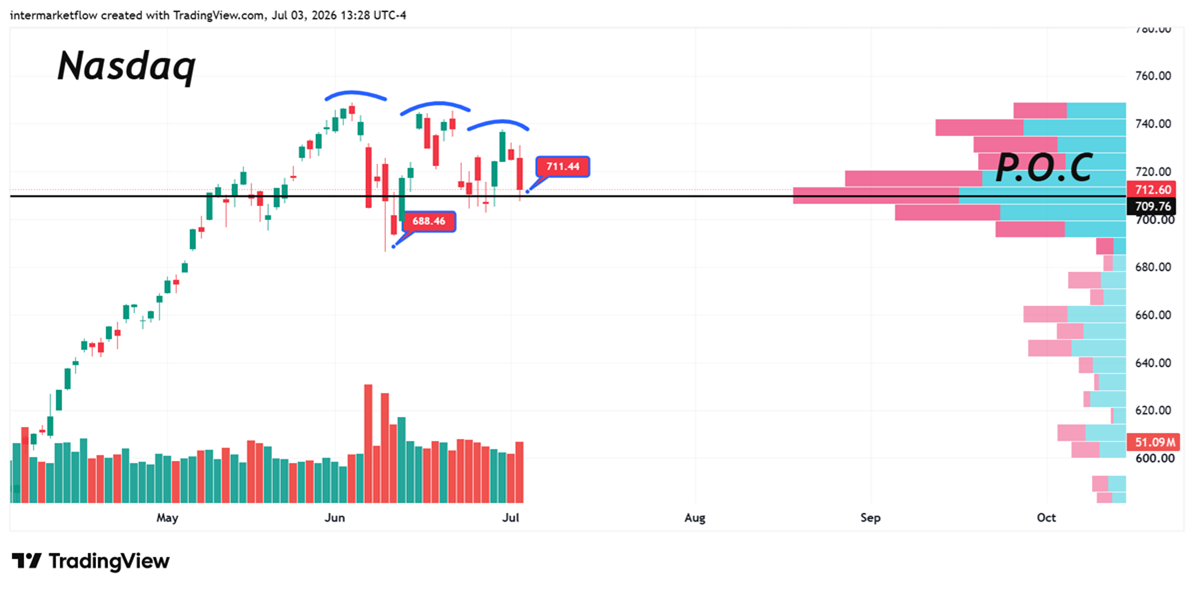
A confirmed close above 305.0 in Russell 2000 or 750.0 in Nasdaq 100, supported by institutional volume expansion, would invalidate the current bearish structure.
Trader’s Note:
- Do not confuse these invalidation points with buy signals. They are the objective thresholds where the data would tell us that the liquidity-drain thesis is no longer the dominant driver of market action.
- Until those conditions appear, the default stance remains:
- Risk-Off / Liquidity Preservation.
Technicals remain unchanged, respecting same breaking points we saw last report
Russell 2000
The systemic health indicator. The chart should show the deterioration in 1W volume against the 287.2 invalidation level. If price breaks this level without volume recovery, the liquidation becomes forced.
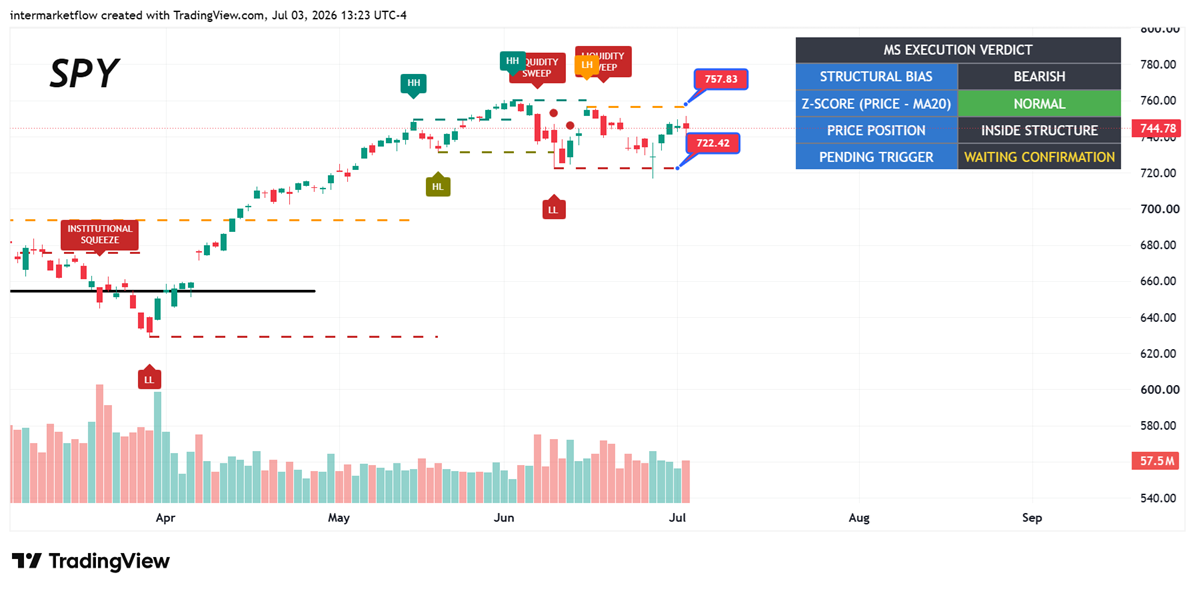
SPY — S&P 500:
The structure is shifting from bullish to bearish and losing traction near recent highs, confirming that capital is no longer rotating inside the market. It is leaving and taking the last two opportunities to sell the rally.
Nasdaq 100 — QQQ:
Point of Control of the last rally, 712. A lack of buying interest below that level validates the technical weakness.
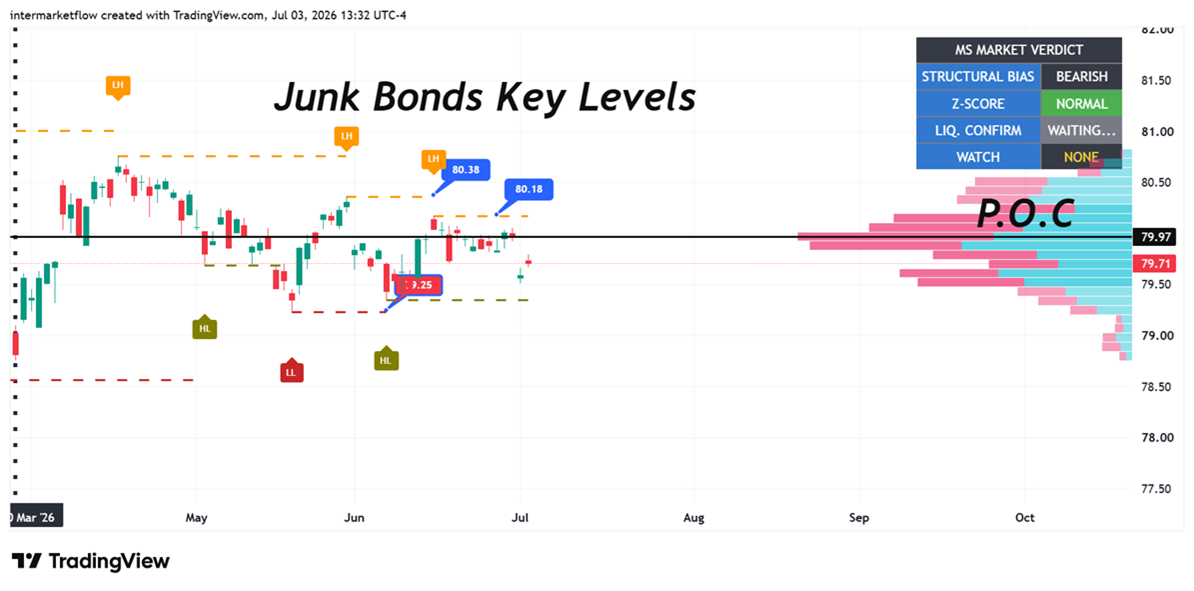
HYG — Junk Bonds:
HYG is the thermometer. The jump from liquidity crisis into credit crisis. If it breaks, the contagion moves next into small caps.
What You’re Paying For
The edge isn’t reacting after the break. It’s understanding the scenarios before the market forces you to choose one.
This week the data already spoke: volume collapsing across every category, correlation at Z-score +1.0 with the 2-year yield, bear flattening with no relief. If you read this and don’t act, you’re not being cautious — you’re choosing to find out late.
The subscription isn’t access to more content. It’s the same read, one week before the market makes you pay for missing it.
If you believe this is an error, please contact the administrator.
Intermarket Flow