
The 48-Hour Shock: Rate Repricing & Systemic Capital Flight
Block 1 — Macro Data: The End of the Soft Disinflation Narrative
This week’s inflation data triggered a violent 48-hour repricing in Fed Funds Futures, catching an overexposed market off guard. The velocity of the adjustment confirms the consensus was incorrectly positioned for a soft disinflationary path and compressed financial stress.
The entire structure of interest rate expectations has shifted aggressively toward a “Higher and Higher for Longer” regime. The market is no longer simply pricing delayed cuts; it is discounting structurally higher terminal rates due to a persistent inflationary environment. This contraction tightens global liquidity conditions, pressures duration-sensitive assets, and compresses equity valuations.
Every business model exposed to rates, at any point in its production process, will suffer.
Fed course of action
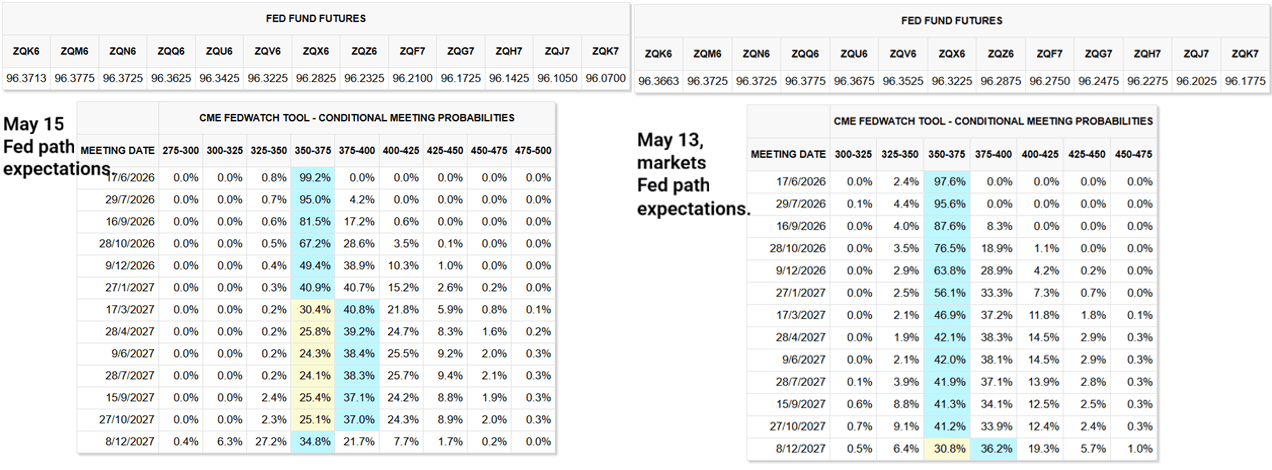
The chart on the right shows what the market expected on Wednesday. The chart on the left shows what it expects today.
Block 2: Intermarket Regime Analysis
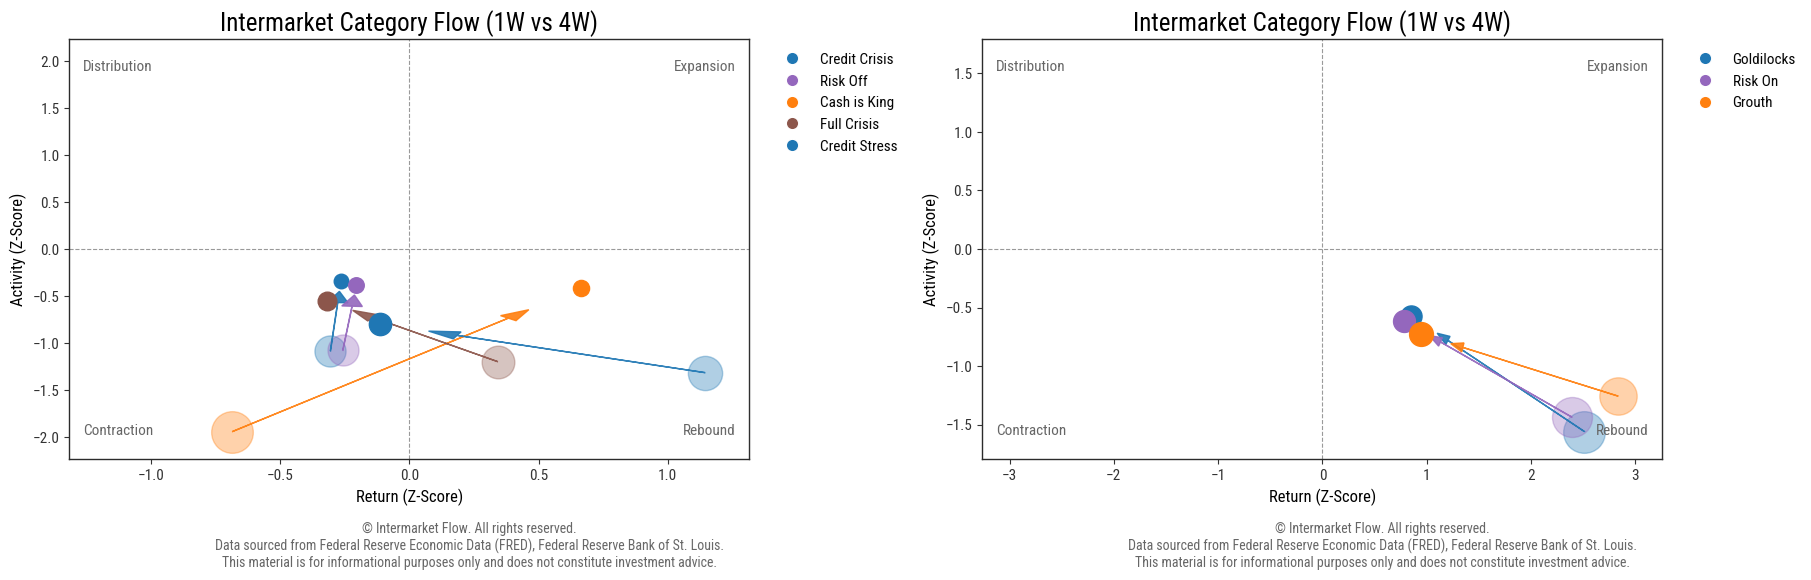
These charts show the transition between the 4-week starting point and the current 1-week positioning. The arrows reveal the direction, size, and velocity of capital rotation between both timeframes, allowing us to identify where flows were concentrated previously and where they are moving now. Bubble size illustrates the magnitude of Dollar Value activity (Z_DV) for the asset within each specific time frame, while the arrows represent the directional transition from the 4W observation toward the 1W observation.
Crisis Scenarios (Left chart)
The construction of synthetic assets allows us to illustrate different stages of the market cycle. In this particular case, when analyzing stress and crisis environments, the dominant regime observed is what we define as a “cash is king” scenario (Orange Arrow).
Growth Scenarios (Right chart)
From the perspective of constructive market regimes, the “Growth,” “Goldilocks,” and “Risk-On” clusters all experienced significant capital outflows, as reflected by the length and displacement of the arrows.
Last week, flows moved aggressively into the U.S. Dollar and Treasury Bills. That alone already allows us to infer several underlying characteristics of the current market environment.
Block 3: Intermarket Asset Category Analysis
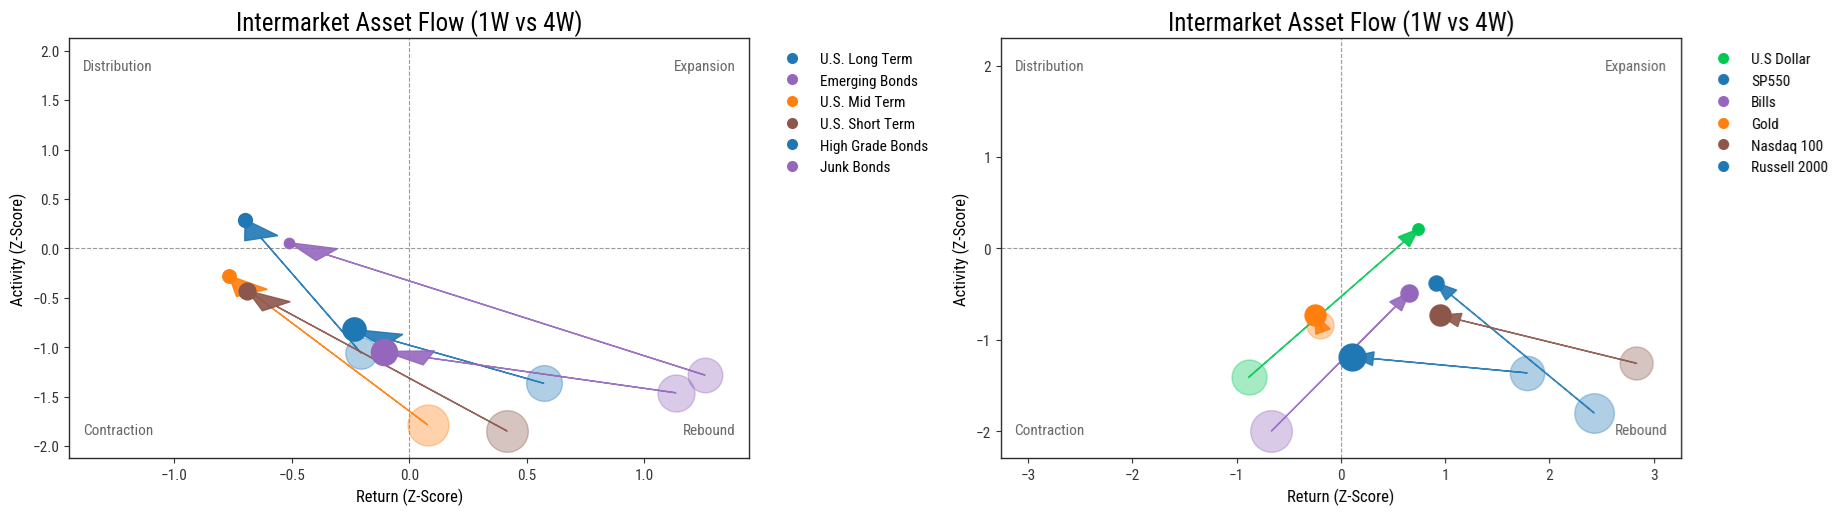
Bonds (Left Chart)
The outflow continues. Even so, we can still infer important characteristics within that movement. Credit quality remains a key factor, as reflected by the difference in the magnitude of the move between junk bonds and the rest of the fixed-income complex.
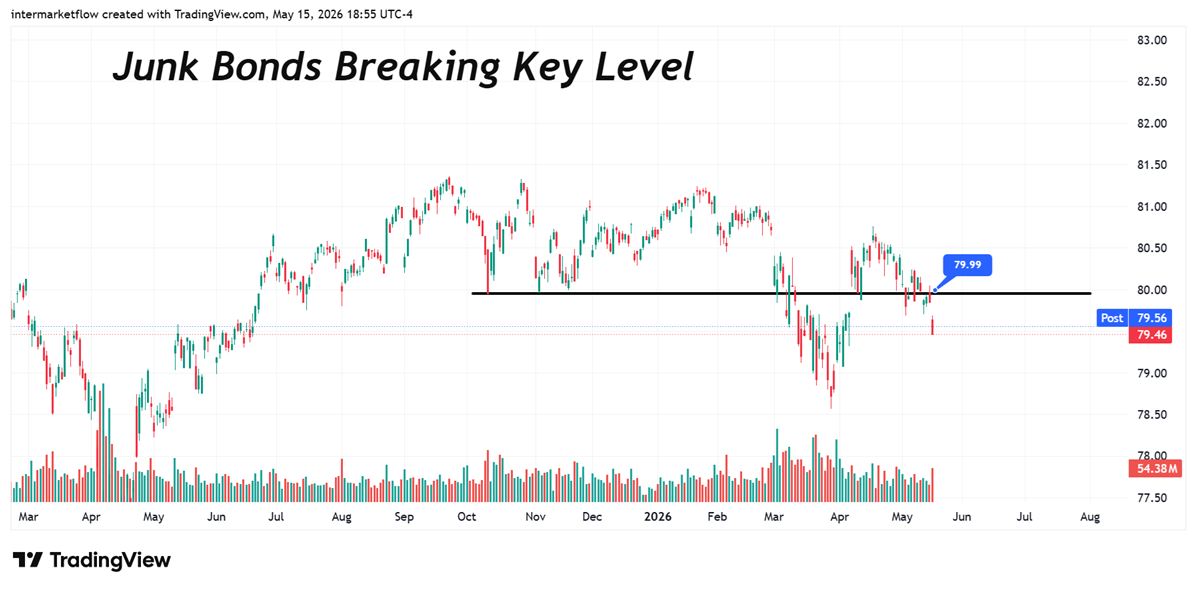
Junk Bonds — This chart confirms a break in risk perception.
It broke the critical 80 support level — flagged several reports ago. This breakdown aligns with our macro thesis: a credit crisis is brewing beneath the surface.
Equities (Right Chart)
Capital is rotating away from duration, lower-quality credit, and high-beta equities toward liquidity and short-term safety.
Validation
The key signal is the 1W vs 4W divergence. Nasdaq, Russell 2000, and Junk Bonds are rapidly abandoning the prior Rebound structure, while the U.S. Dollar is the only asset moving cleanly into Expansion with both Return (Z_RET) and Activity (Z_DV) accelerating simultaneously.
Volume and Volatility of these flows
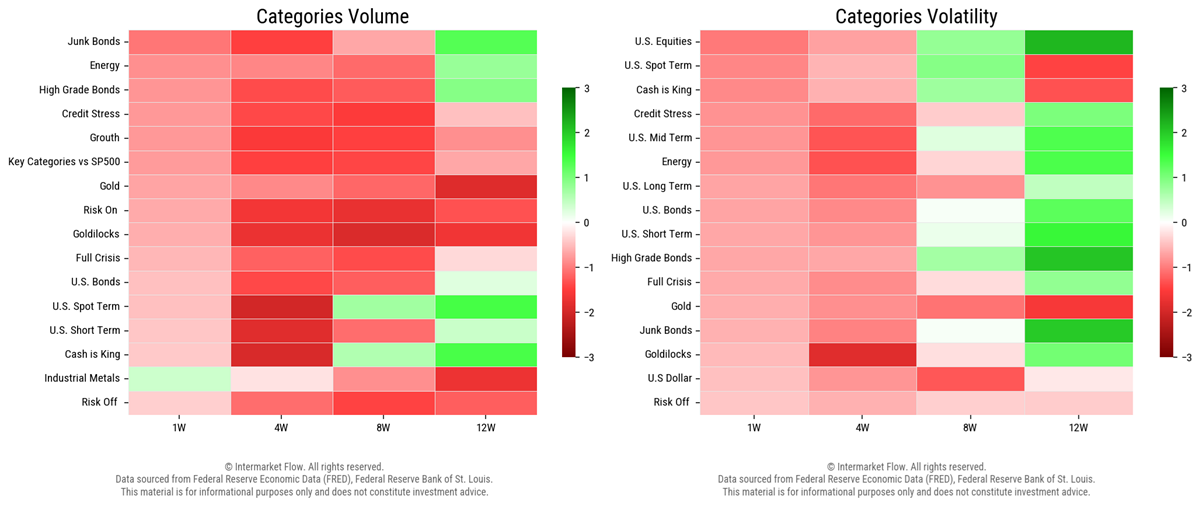
Volume (Left Chart)
Looking across the timeframes from 12 weeks ago through today, the color gradient illustrates how volume has generally been fading across the market.
Within that backdrop:
Junk bonds experienced the largest deterioration in participation.
Gold stands out as the asset that maintained relatively stable flows throughout the last 12 weeks, including the most recent one.
Volatility (Right Chart)
The last 12 weeks were characterized by extreme volatility, particularly within equities. Since then, volatility has been undergoing a continuous compression process across most assets. This complements the previous information and further characterizes the current regime.
Capital is in dollars, watching from money markets and ultra-short-term debt.
Block 4: Intra-market Reading — Internal Confirmation of the Intermarket Structure
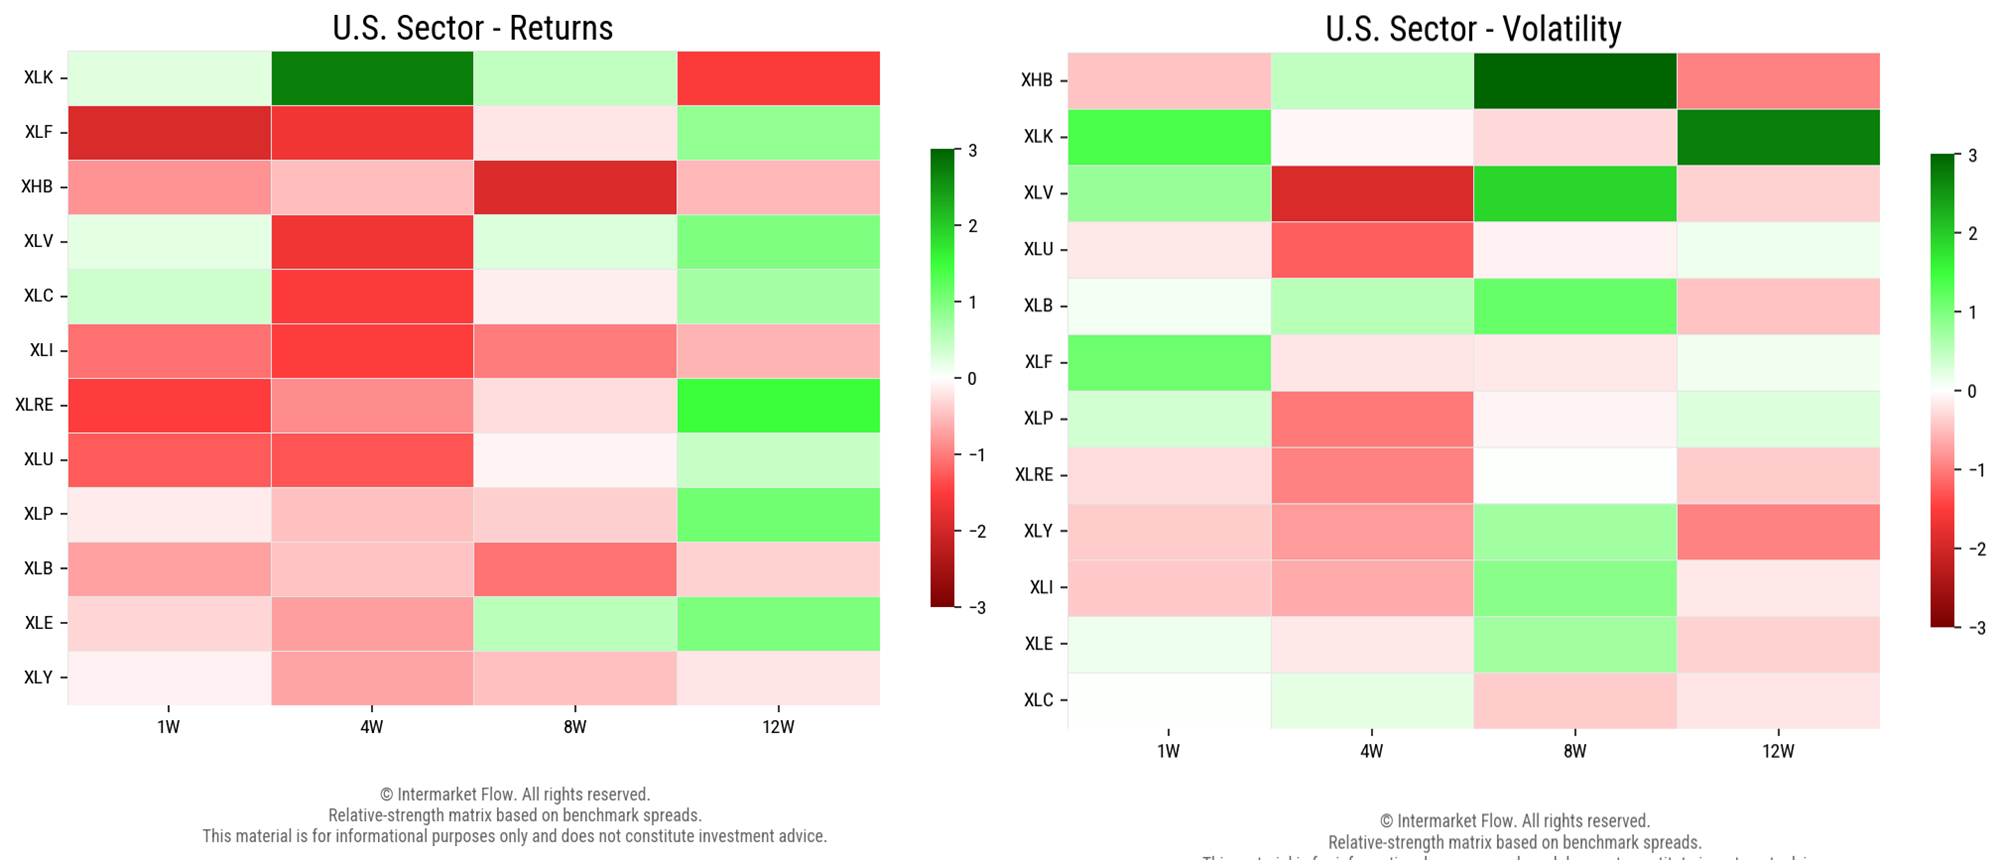
Technology (XLK)
XLK is showing declining returns alongside rising volatility — a clear symptom of weakness and lack of conviction in the sector that has been holding the market up.
Financials (XLF)
Financials are showing the same pattern as Technology — but more pronounced. The heart of the economy is now seeing returns fall into negative territory, with volatility continuing to rise. This sector is displaying even greater weakness than Technology.
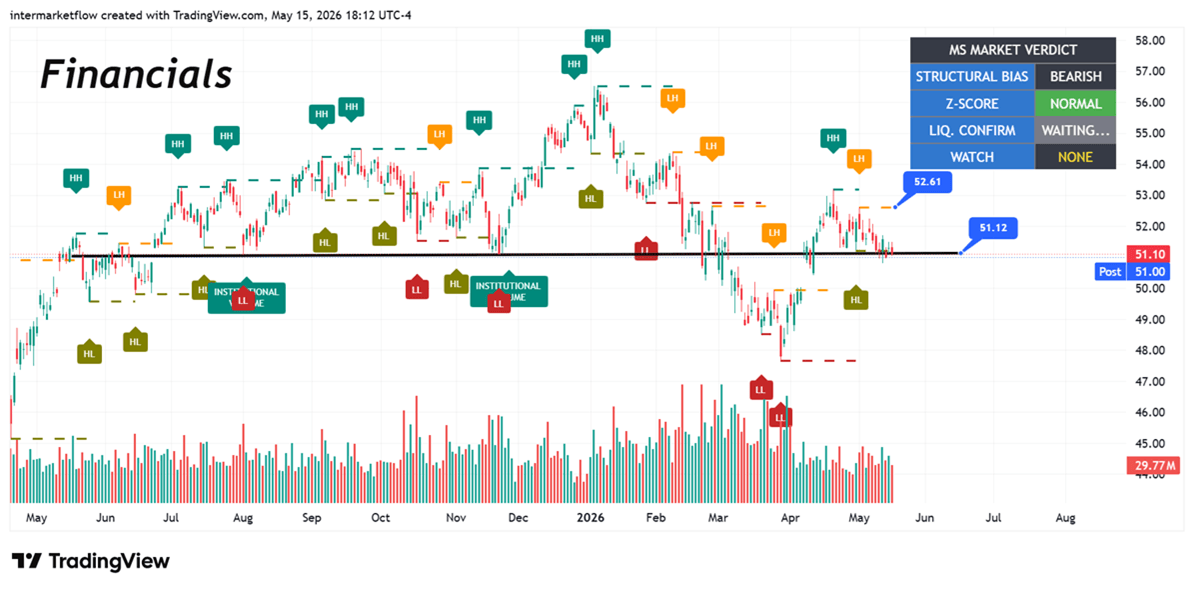
Confirmation of breakdown at the 51 zone on a weekly closing basis. Invalidation — or postponement — of the bearish case on a weekly close above 52.61.
When Financials begin to simultaneously display deteriorating returns, expanding volatility, and unstable participation, the signal becomes significantly more important than an isolated sector rotation. Financial conditions, credit creation, liquidity transmission, and systemic confidence all flow through this part of the market. Weakness here rarely remains contained for long.
Industrials (XLI)
Industrials are displaying the same pattern. Over the last 12 weeks, this deterioration has been consistent across leading and cyclical sectors alike.
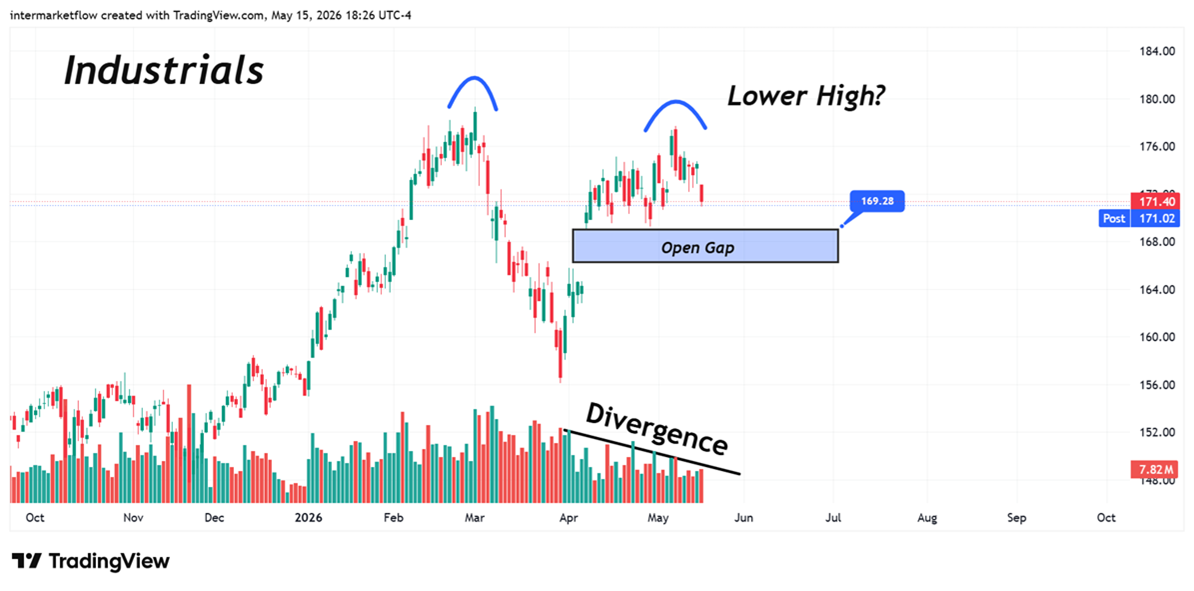
Inflection Point 169.29. Last completed bullish impulse in divergence — progressively fewer buyers.
Home Builders (XHB)
Another Systemic Chart on the Edge of Technical Collapse.
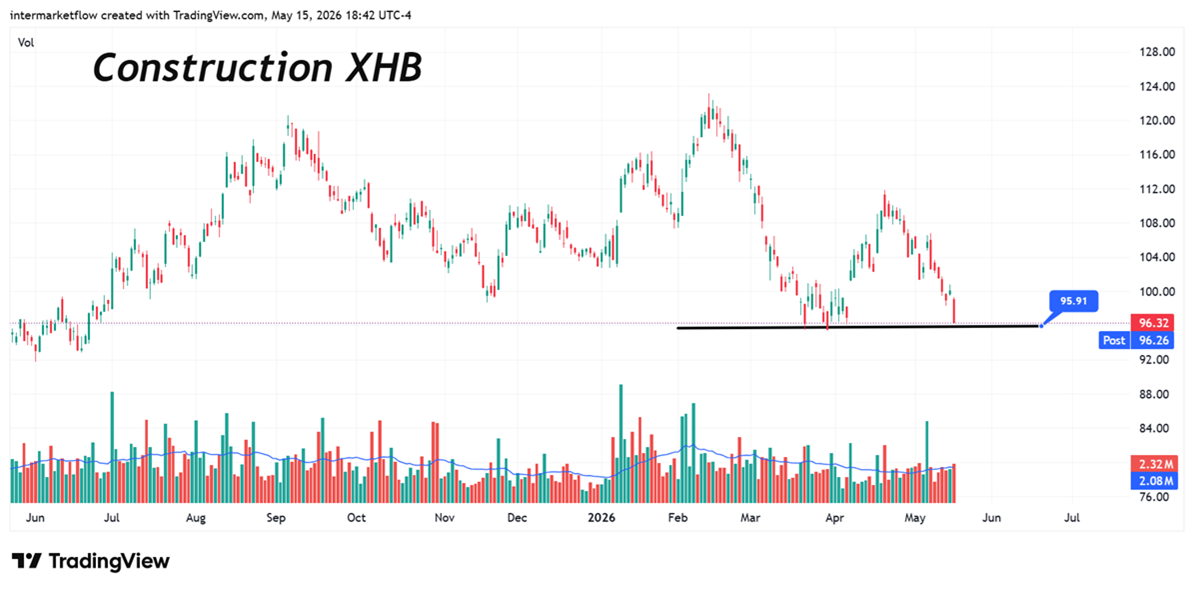
The break of 95.91 is technical confirmation of bearish continuation.
Reat Estate (XLRE)
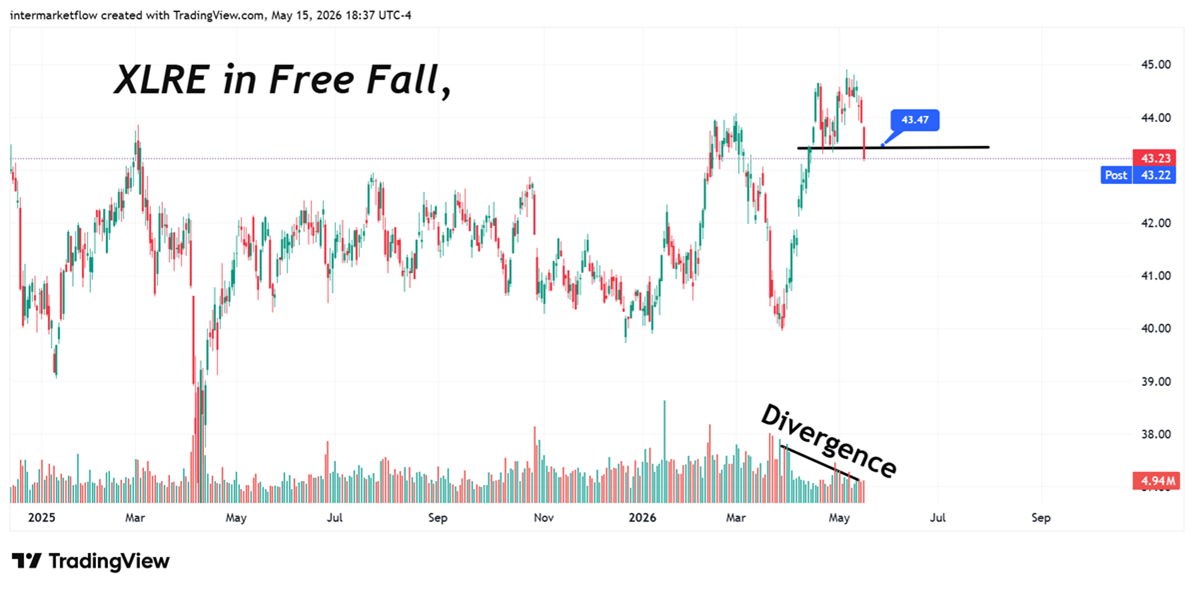
Weekly close is already confirming the technical breakdown.
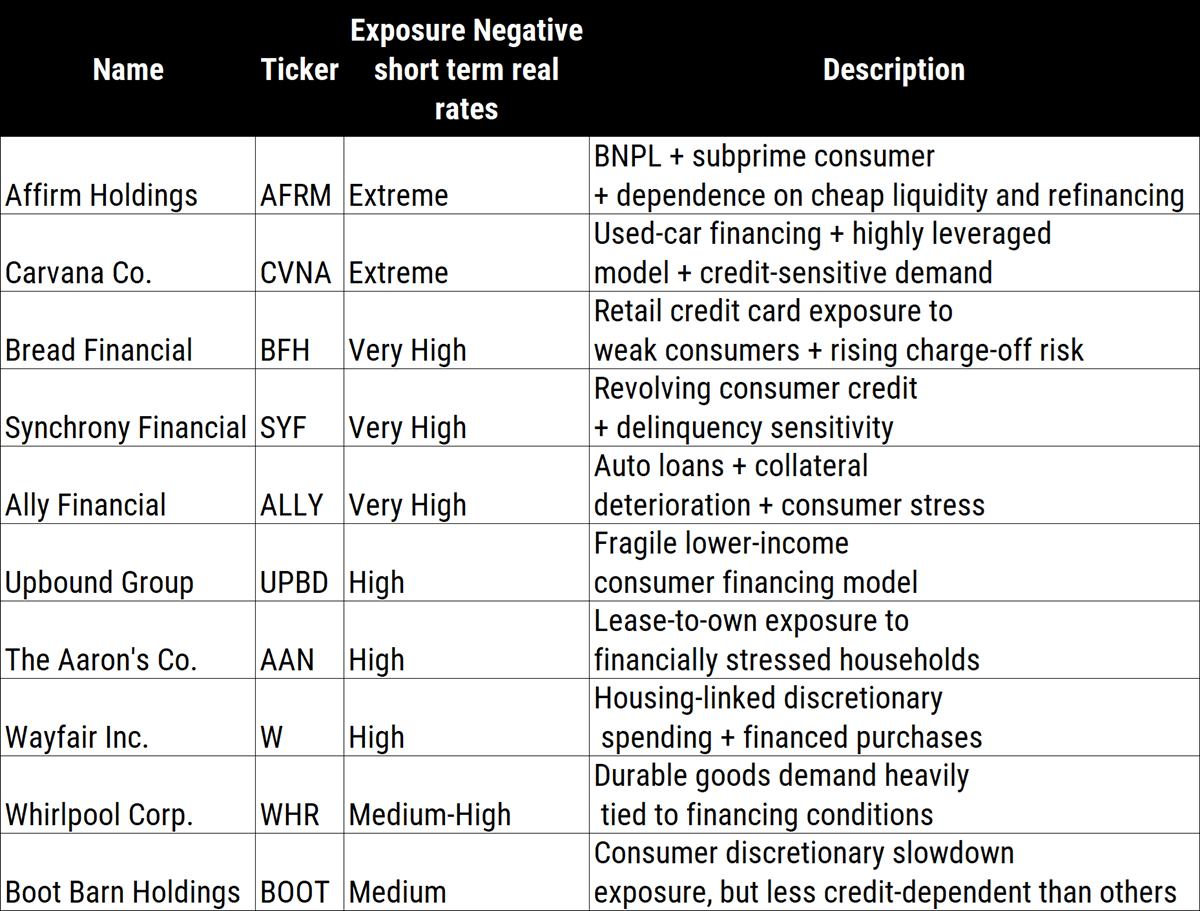
Block 5: Mid-Week Alpha Preview
Asymmetric Alpha Matrix: The upcoming Wednesday Report will deliver a full mapping of highly vulnerable, rate-exposed vehicles currently distribution-heavy under our $Z_{DV}$ framework. These represent the cleanest short targets for the next phase of liquidity contraction.
Block 6: Conclusions
1. Absolute Refuge in USD: Overweight T-Bills and Money Markets. Clean expansion in real flow ($Z_{DV}$) validates the flight to pure liquidity. Strictly avoid credit risk and duration-sensitive assets.
2. Financials (XLF): A weekly close below 51.00 triggers a systemic failure signal. Invalidation/Posponement: weekly close above 52.61.
3. Trim XLK & XLI: Reduce tech and cyclical exposure to minimum operational levels given declining returns and expanding volatility. Critical control pivot: XLI weekly close below 169.29 confirms full macro capitulation.
4. Passive Allocation in Gold: Maintain structural weight in XAU. It solidifies as the only refuge alternative with stable flows and compressed volatility against the rate shock.