Executive Summary
- Regime Transition: shift from a “Cash is King” environment toward early reallocation into duration. The 4W vs. 1W flow divergence highlights a structural monthly distribution (Z_DV: -2.50) versus a short-term technical bounce.
- Strategic illiquidity remains a defining feature, with activity near Z ≈ -2, underscoring market fragility due to collapsed participation.
- Intermarket validation continues to rely on credit (HYG) and yield curve volatility as leading indicators.
- Operational control zones remain clearly defined, with key levels at 80 and 81.50 guiding tactical bias and invalidation.
- Post-mortem analysis: The Trader’s Log
Return vs Activity (4W → 1W Transition)
From the large bubble (4W) to the small bubble (1W), we track how return and activity evolve across major asset classes. The 4-week timeframe captures aggregate capital flows and defines the structural regime, while the 1-week window reflects short-term positioning.

Observations
Major asset classes remain clustered at the lower end of the y-axis (Activity Z-score ≈ -2), reflecting a broad collapse in participation. The transition from 4W (monthly) to 1W (weekly) highlights a systemic inability to generate conviction across timeframes.
Synthesis
Price action is being sustained on thin liquidity, increasingly driven by derivatives market mechanics rather than underlying cash flows. In the absence of volume and capital inflows, current levels lack structural support. The market remains in a “Cash is King” transition phase, with low conviction and rising uncertainty.
Quantitative Framework
The multi-timeframe structure isolates regime (4W) from short-term evolution (1W), incorporating volume and volatility to assess direction, strength, and conviction.
The Forest: Monthly Time Frame (4W)

The monthly regime reflects a structurally weak environment.
- Equities show slightly positive returns but with a severe contraction in activity and volume, indicating low participation.
- Credit does not confirm, with junk bonds flat and high grade negative under depressed flows.
- Across the yield curve, returns are negative and activity remains subdued, consistent with defensive positioning without meaningful capital inflows.
This regime reflects the post “Cash is King” environment.
The Tree: Weekly Time Frame (1W)

The weekly structure reveals the transition in progress.
- Equities exhibit internal divergence, with large caps maintaining positive returns while losing flows and volume, as small caps attract capital.
- Credit deteriorates, with junk bonds declining despite inflows and high grade remaining weak, signaling underlying stress.
- Along the curve, volatility rises sharply in the short and mid segments, while flows rotate into the long end, indicating demand for duration and positioning for lower rates.
Consolidating Time Frames: 4W vs 1W Divergence
Equity internals point to distribution masked as resilience. While the 1W window shows modestly positive returns, the 4W structure reflects persistent capital outflows (SP500 Z_DV: -2.50), indicating price is being supported by positioning rather than genuine inflows. The rotation into small caps reflects relative reallocation rather than expansion, as mega-cap leadership weakens.
Credit as the Anchor and Validator
Credit remains the primary validation layer and is not confirming the short-term bullish narrative. If high yield fails to stabilize, the divergence between equities and credit is unlikely to persist, increasing the probability of a sharp adjustment. Credit defines the system’s risk boundary.
Term Structure and the Flight to Duration
The yield curve is leading the transition into a defensive regime. Elevated volatility in the short end (Z_VOLAT_1W: 1.50) reflects active repricing of macro expectations, while inflows into the long end (Z_DV_1W: 0.88) confirm demand for duration. This dynamic is consistent with positioning for slower growth or emerging liquidity stress.
Gold
Gold reflects prior liquidation in the monthly timeframe, consistent with the “Cash is King” phase. On a weekly basis, flows stabilize and returns recover, suggesting early re-accumulation as capital rotates back into defensive hedges.
Conclusion
Across timeframes, the system is transitioning from a low-participation, cash-dominated regime toward early capital reallocation, led by duration and selective rotation. However, the lack of confirmation from equities and credit reinforces that this transition remains fragile and incomplete.
Probable Sequence
This reflects rotation combined with systemic fragility. Large caps lose flows, small caps take leadership, credit fails to confirm, and the curve comes under stress. This sequence increases the probability of a disorderly adjustment or event.
Trading Translation
- Do not chase upside in major indices.
- Focus on divergences and relative weakness, and prepare for reversal setups or breakdowns.
The regime is changing, but the system cannot sustain it.
Key Levels (Credit)
- HYG below 80 on a daily and weekly close confirms a credit breakdown and anticipates equity correction.
- HYG above 81.50, with positive flows, invalidates the bearish scenario and supports a transition into a new regime.
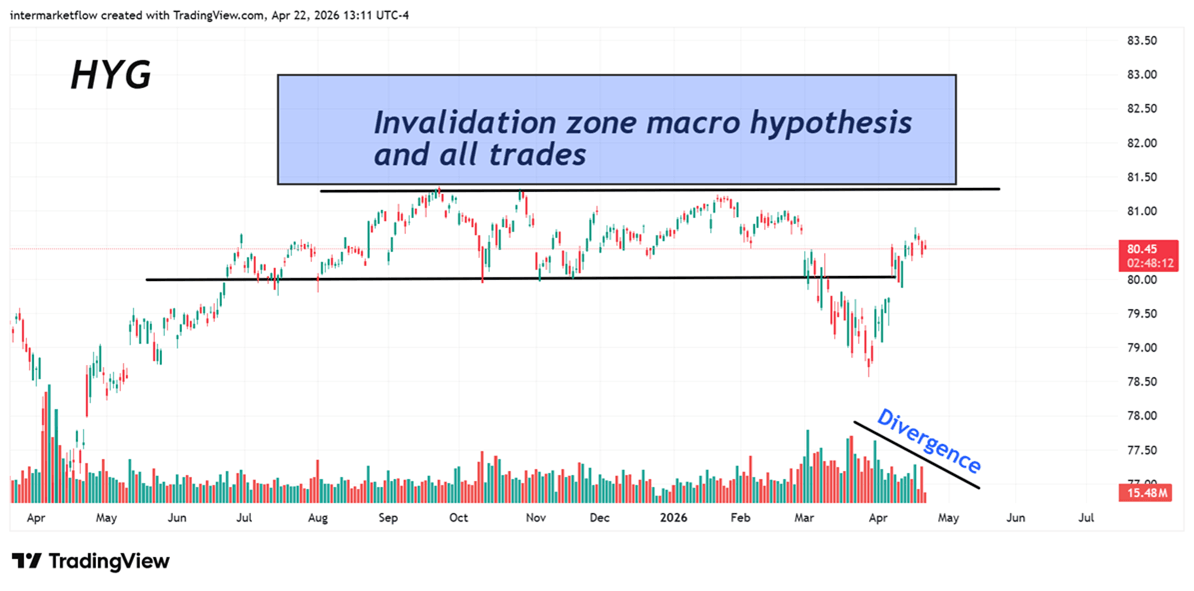
Volume is the missing piece in today’s market. Its presence—or continued absence—will ultimately validate the move in whichever direction it emerges.
Post-Mortem Analysis — Trader’s Log
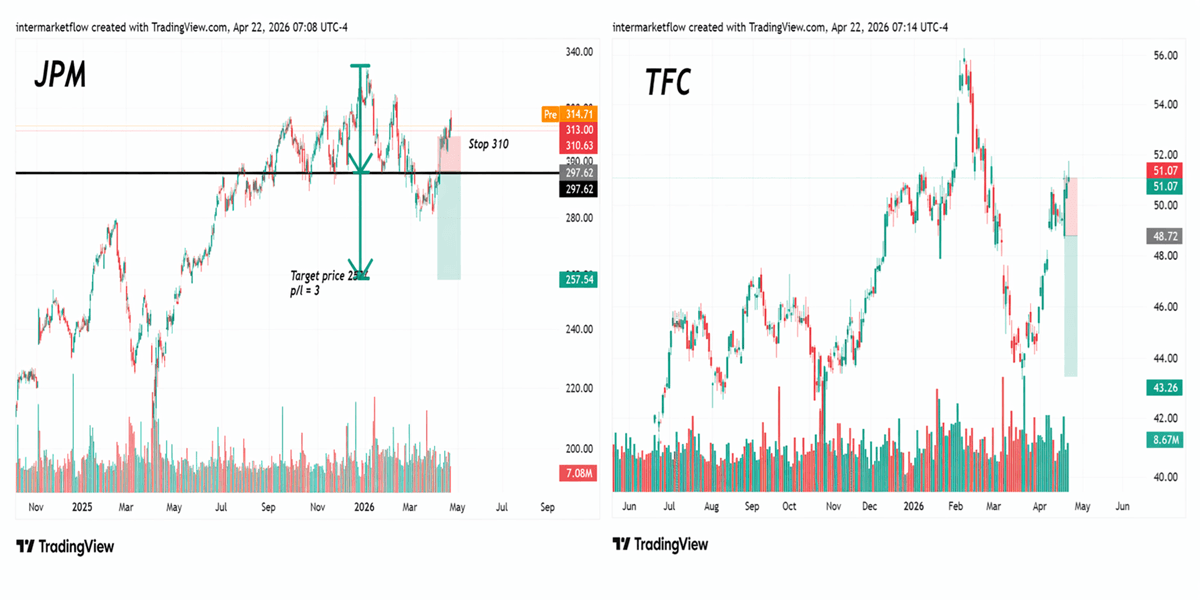
Mistakes
- We underestimated the importance of the gamma flip level in the current environment, where options-driven flows dominate short-term price action.
- We anticipated entries without confirmation from validating instruments
- We traded a macro thesis that had not yet been confirmed in price, entering prematurely despite a technically sound setup.
Strengths
- Execution scaling entrance positions mitigated risk.
- Trade under a clear macro hypothesis.
Intermarket Flow
If you believe this is an error, please contact the administrator.